Change Points
Intended audience: END-USERS DATA SCIENCE DEVELOPERS
AO Easy Answers: 4.3
Overview

When values trending in a time series suddenly and significantly change from the previous trend it is called a change point. This insight identifies the different change points in the time series. Such abrupt changes may represent transitions that occur between states.
Purpose
Identify points in time where a significant change occurs in the data pattern.
Business Example
Detecting shifts in product sales trends to understand the impact of marketing campaigns or external factors.
Scenario
A retail company wants to determine if there have been significant changes in the sales trends of a particular product over time. This could be due to various factors such as a new marketing campaign, seasonal effects, changes in consumer behavior, or competitive actions. The company needs to identify these change points to take timely action and adjust their strategies accordingly.
Results
By detecting change points, the company can pinpoint when and why a shift in sales occurred. This can help them understand the effectiveness of their marketing campaigns, identify potential external factors influencing sales, and make informed decisions on inventory management and future marketing strategies. If a positive shift is detected (e.g., a sales increase after a campaign), the company might double down on similar strategies. Conversely, if a negative shift is found, it could prompt an investigation and corrective measures.
Data Sample
Date | Product_Sales | Inventory_Levels | Marketing_Spend |
|---|---|---|---|
2023-01-01 00:00:00 | 209.9342831 | 442.9155443 | 1048.186606 |
2023-01-02 00:00:00 | 197.234714 | 490.317027 | 1054.72648 |
2023-01-03 00:00:00 | 212.9537708 | 464.158884 | 1054.888384 |
2023-01-04 00:00:00 | 230.4605971 | 406.6731691 | 974.5044206 |
2023-01-05 00:00:00 | 195.3169325 | 495.8659657 | 987.454574 |
2023-01-06 00:00:00 | 195.3172609 | 493.9126246 | 1032.787952 |
2023-01-07 00:00:00 | 231.5842563 | 575.6724872 | 1008.589301 |
2023-01-08 00:00:00 | 215.3486946 | 531.5405842 | 778.0699627 |
2023-01-09 00:00:00 | 190.6105123 | 448.7906588 | 977.0200369 |
File
changepoints_product_sales.xlsx
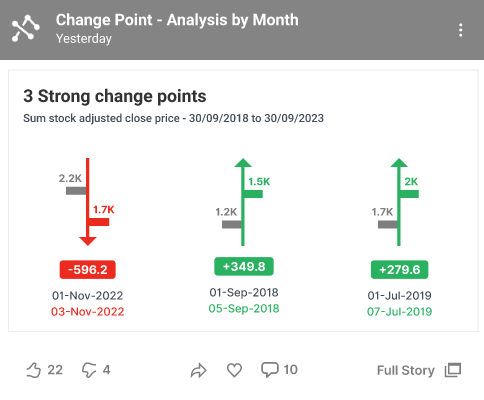
Infographics Insight
Example Quick Insight Template used on Insight Feed page
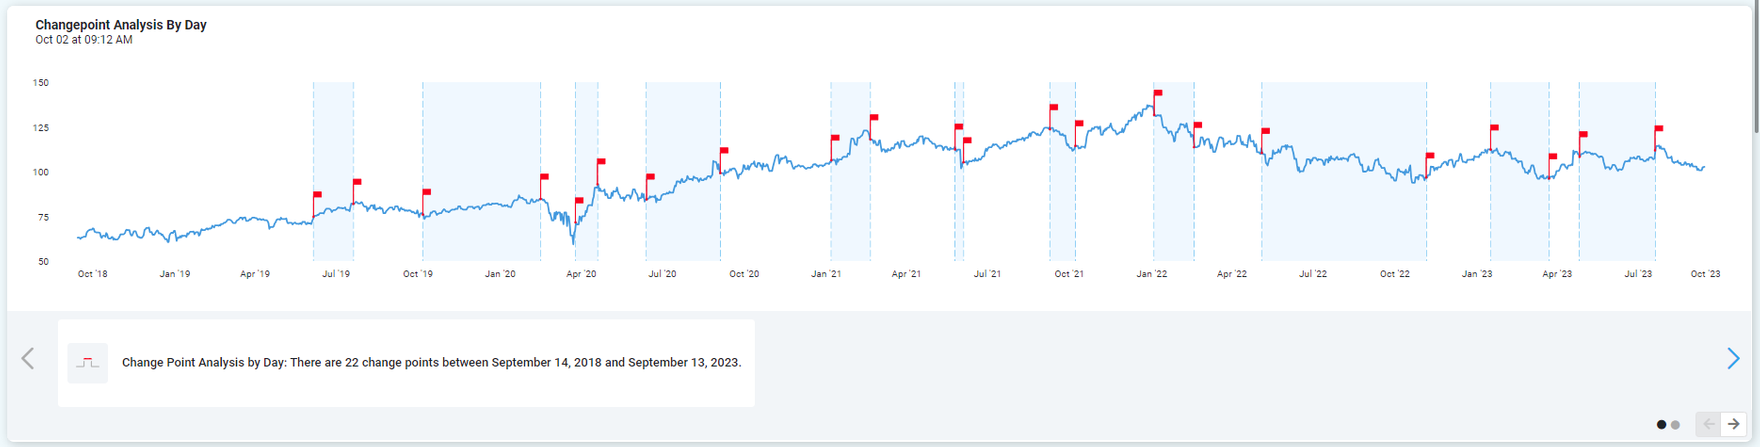
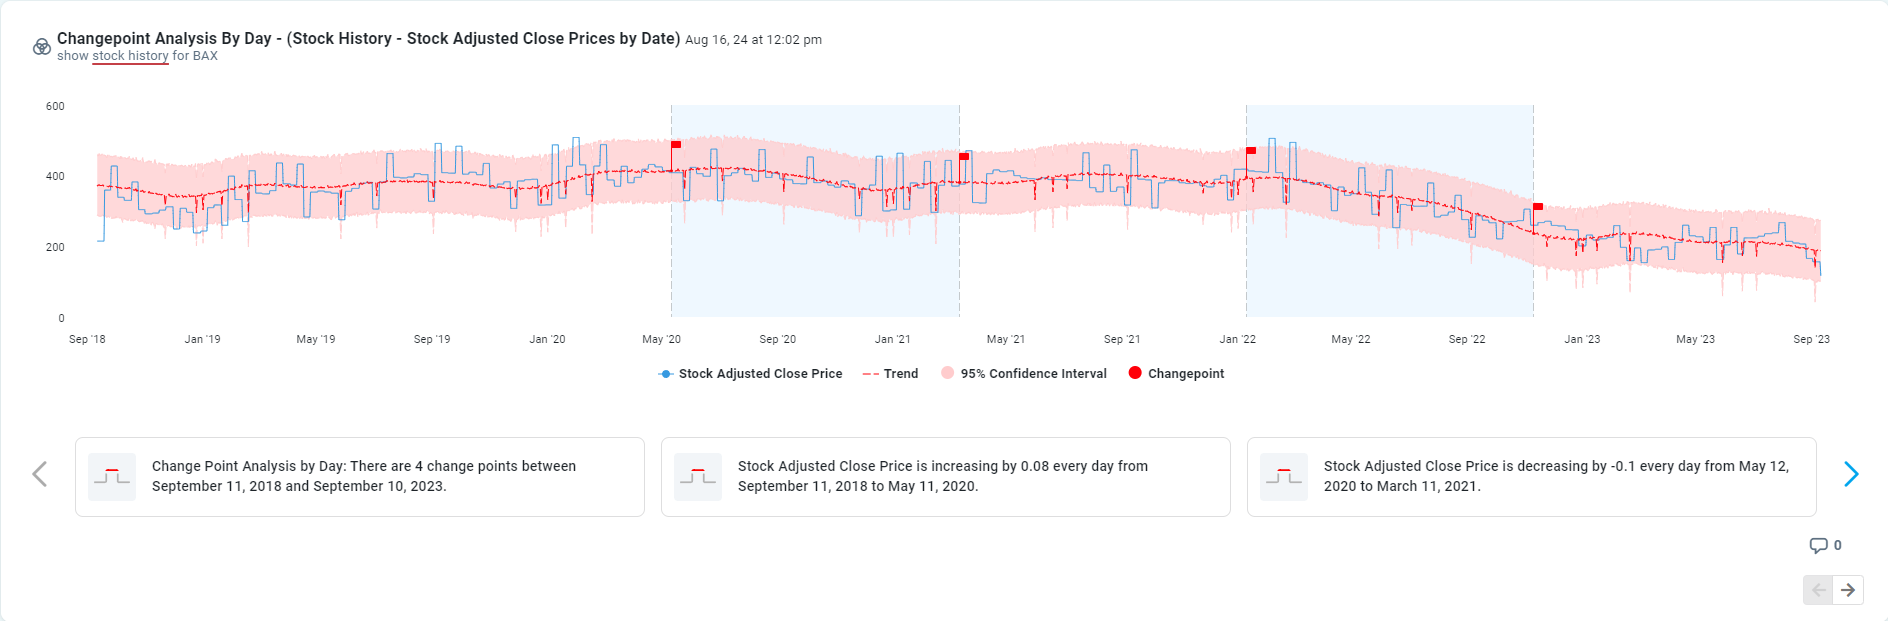
Full Story Insight
Example Quick Insight output with details
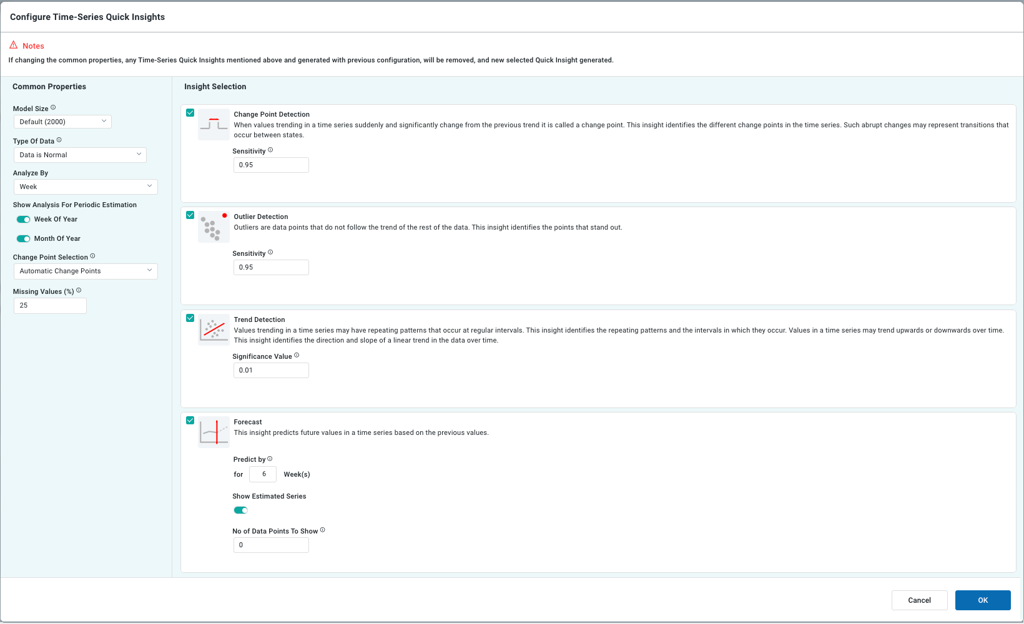
End User Configuration - using Easy Answers solution