Correlation - Time-Series
Intended audience: END-USERS DATA SCIENCE DEVELOPERS
AO Easy Answers: 4.3
Overview

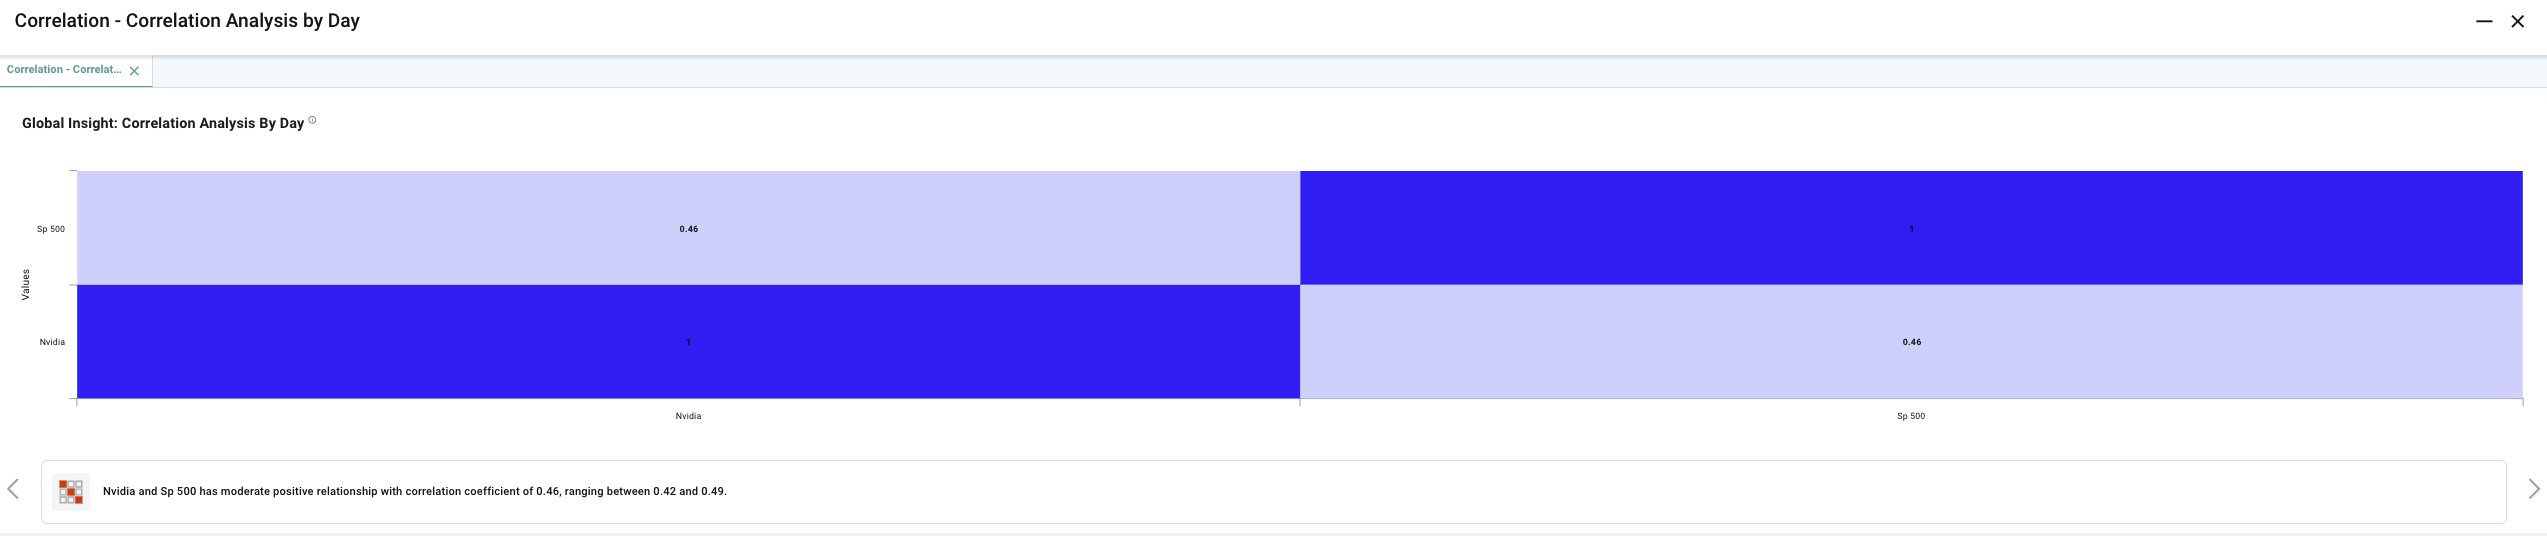
The Correlation for Time-Series Insight generates a Correlation Heatmap for series selected.
Purpose
The primary purpose of forecasting in a financial context is to predict future stock performance by analyzing historical data. This enables financial institutions, such as stock brokerage firms, to identify patterns, cycles, and correlations that influence stock prices over time. Understanding these relationships allows firms to make informed predictions about future stock movements, ultimately guiding investment decisions.
Business Example
Stock brokerage firms frequently analyze historical stock prices alongside key market indices to uncover trends and patterns. For instance, they might study the relationship between a company's stock price and broader market indices such as the S&P 500 and NASDAQ. By forecasting how these relationships might evolve, these firms can make strategic recommendations to their clients regarding buying, selling, or holding specific stocks.
Scenario
Consider a scenario where a stock brokerage company is closely monitoring Nvidia’s stock price about broader market trends. Between December 27th and December 30th, 2018, Nvidia's stock price remained steady at $100.1. During the same period, the S&P 500 index stood at 7,489.86, and NASDAQ showed a consistent trend as well. The firm seeks to understand how Nvidia's stock moves in response to fluctuations in the S&P 500 and NASDAQ over time.
If the analysis reveals a strong correlation between Nvidia’s stock price and the movements of the S&P 500, the firm can leverage this information to forecast future price changes. For example, if Nvidia's stock historically rises following an increase in the S&P 500, the firm might predict a similar rise in the future. This insight enables the brokerage to advise clients on potential investment strategies, such as whether to buy or sell Nvidia stock based on anticipated market conditions.
Results
Through forecasting and multi-time series analysis, the brokerage firm can better anticipate changes in stock prices by examining their relationship with major market indices like the S&P 500 and NASDAQ. This proactive approach equips the firm with the tools to provide more accurate investment recommendations, thereby improving client portfolio performance and enhancing overall customer satisfaction.
By understanding the interplay of various market forces through multi-time series analysis, the firm can offer more comprehensive and precise financial advice. This ability to anticipate future fluctuations in stock prices across different market conditions gives the firm a competitive advantage. As a result, they can strengthen their market position and build long-lasting trust with clients by consistently delivering reliable and well-rounded investment strategies.
Data Sample
Date | Nvidia | Sp 500 |
12/27/2018 | 100.1 | 7,489.86 |
12/28/2018 | 100.1 | 7,489.86 |
12/29/2018 | 100.1 | 7,489.86 |
12/30/2018 | 100.1 | 7,489.86 |
12/31/2018 | 100.1 | 7,489.86 |
01/13/2019 | 189.45 | 13,115.68 |
01/14/2019 | 189.45 | 13,115.68 |
01/15/2019 | 189.45 | 13,115.68 |
Infographics Insight
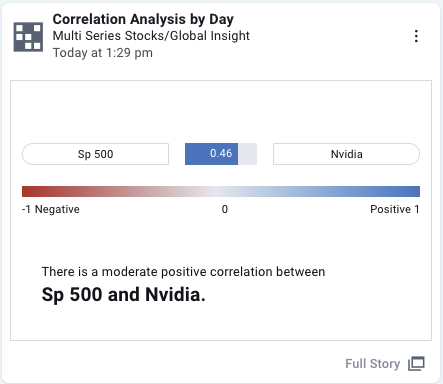
Full Story Insight
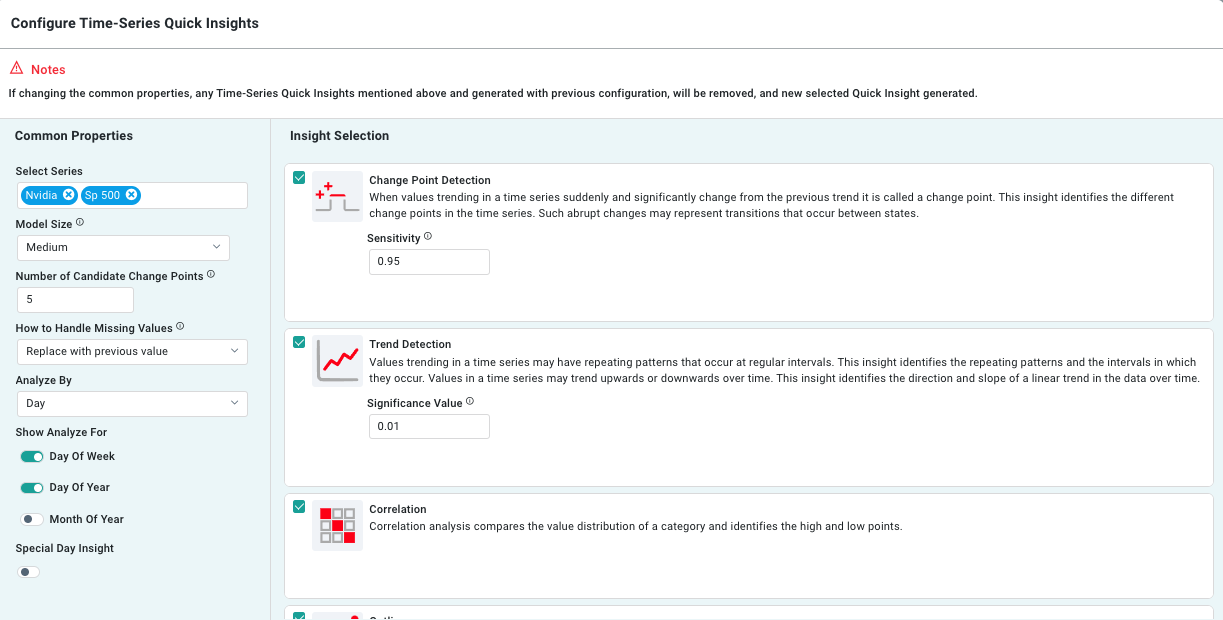
End User Configuration - using Easy Answers solution