Insights Based on Advanced Machine Learning Models
Intended audience: END-USERS DEVELOPERS
AO Easy Answers: 4.2
Overview
These Insights are system-generated visualizations and textual descriptions using advanced machine learning and predictive analytics by analyzing the data from the ontology used in a given solution. Visualization focuses on a high-impact, simple depiction of the Insight using Infographics and Charts.
Insights are typically generated according to a schedule that allows the predictive analytics results to reflect updates based on new data being added and existing data updated during daily operational activities.
There are different levels of Machine Learning Model Insights:
Insights based on the full ontology of a system - for instance, a Utility’s ontology dealing with different types of Assets, Customers, Vendors, Contracts, etc…
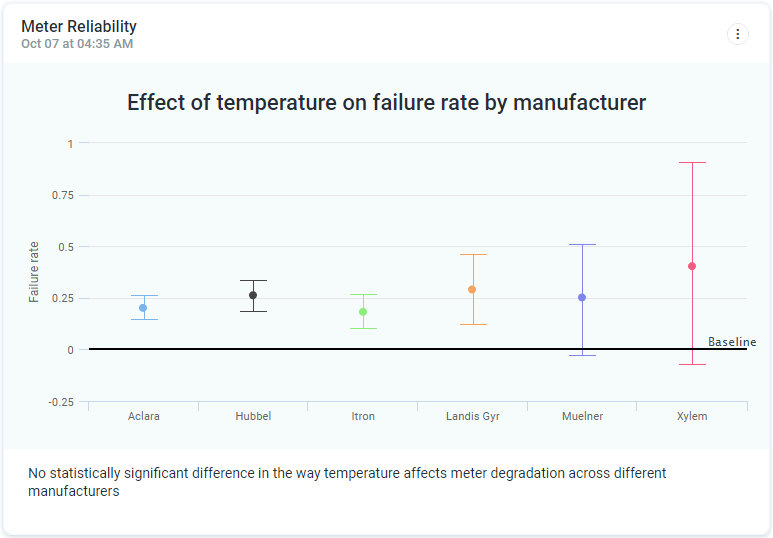
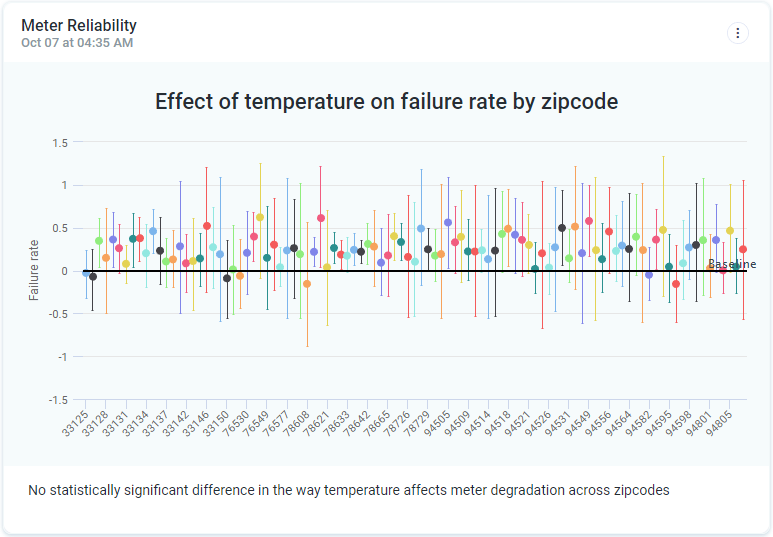
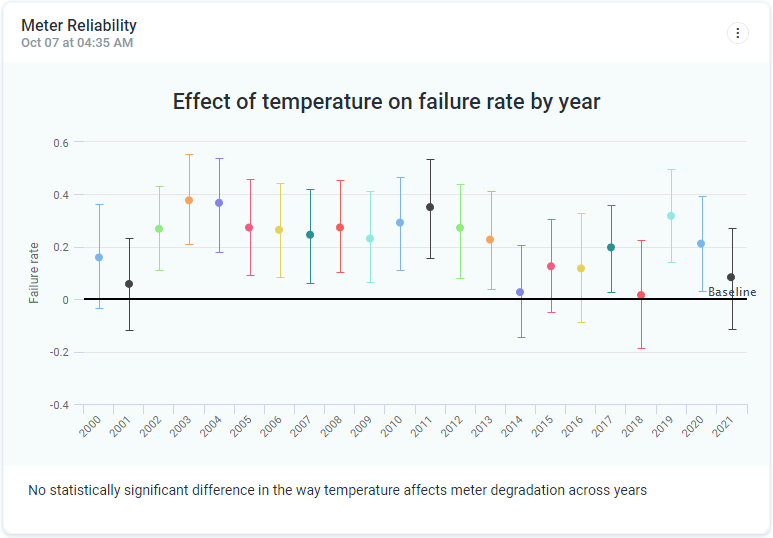
Insights based on specific elements of the ontology - for instance, Meter assets in a Utility, where the predictive analytics considers lifespan and failure patterns for different Meter Types by generating a baseline for all Meters.
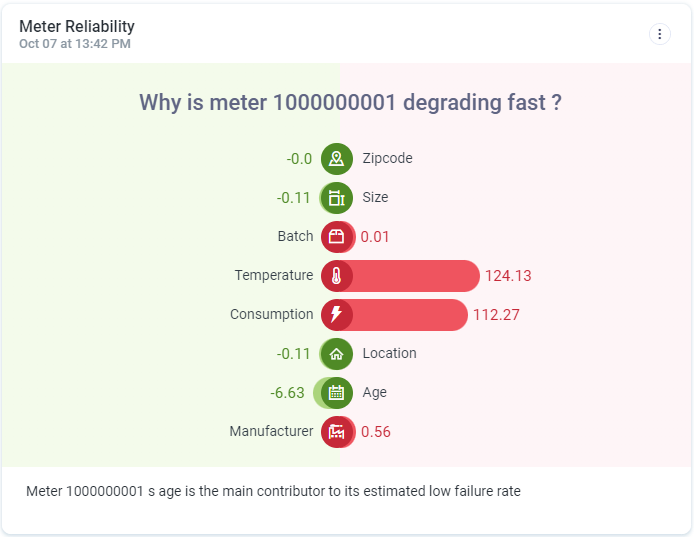
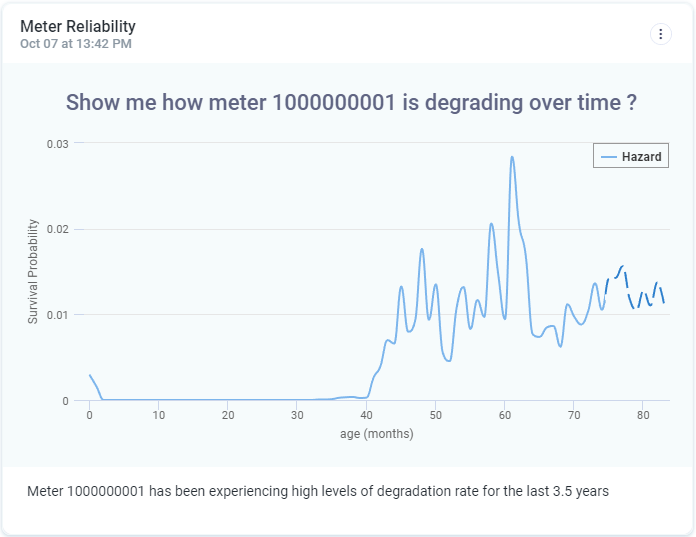
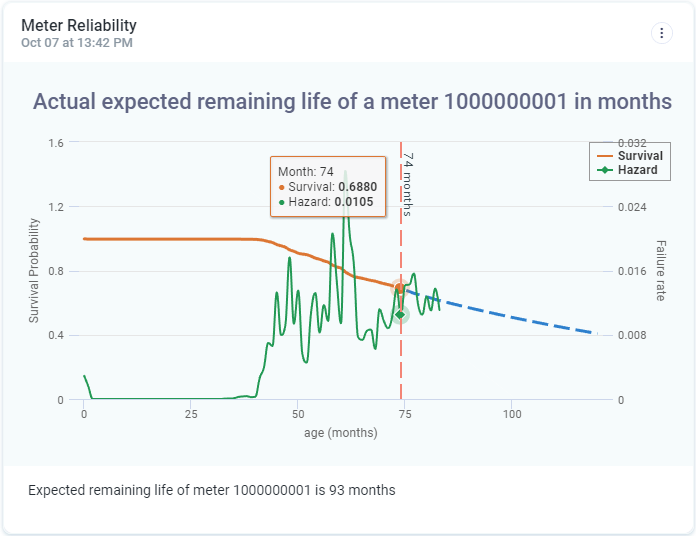
Insights based on a specific data point from an element in the ontology - for instance, a specific Meter ID that shows an anomaly or sudden unusual spike in behavior.
Accessing Insights Based on ML Models
Insights may appear in different ways in a solution, but the default location is identified by the “brain” icon in the header section of a solution, right next to the Easy Answers question field, typically with a number as a decorator to show how many Insights are available, like this:

Click the icon, and the Insights Feed page opens.
Each Insight card typically contains a title and date (identifying when the data was generated), a curation visualizing the Insight, and in the footer, an articulated response to help the user understand the data presented. This response is a system-generated response from a Generative AI system.
User Actions
Each Insights card has an Action menu with the following options:
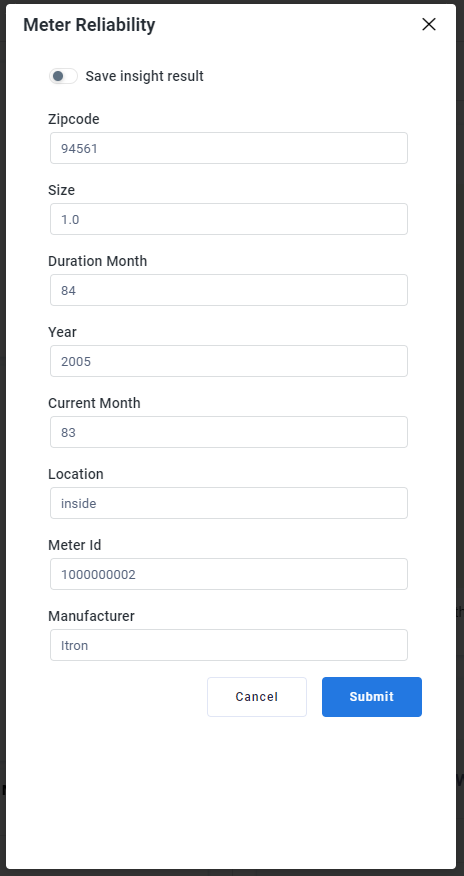
Edit Insight - this option is only available for Insights based on a specific data point from an element in the ontology, eg a Meter ID. It allows users to quickly request updated Insights by changing one or more of the input parameters, such as the time period, the manufacturer, or the material of the specific Meter.
Refresh - refreshes the Insight card manually. This will rerun the analytics.
Export as CSV - exports the data in Insight to a comma-separated value file.
Move to Previous / Next View - some Insight cards may have multiple views. Use the arrows in the bottom/right corner to move between the different views.
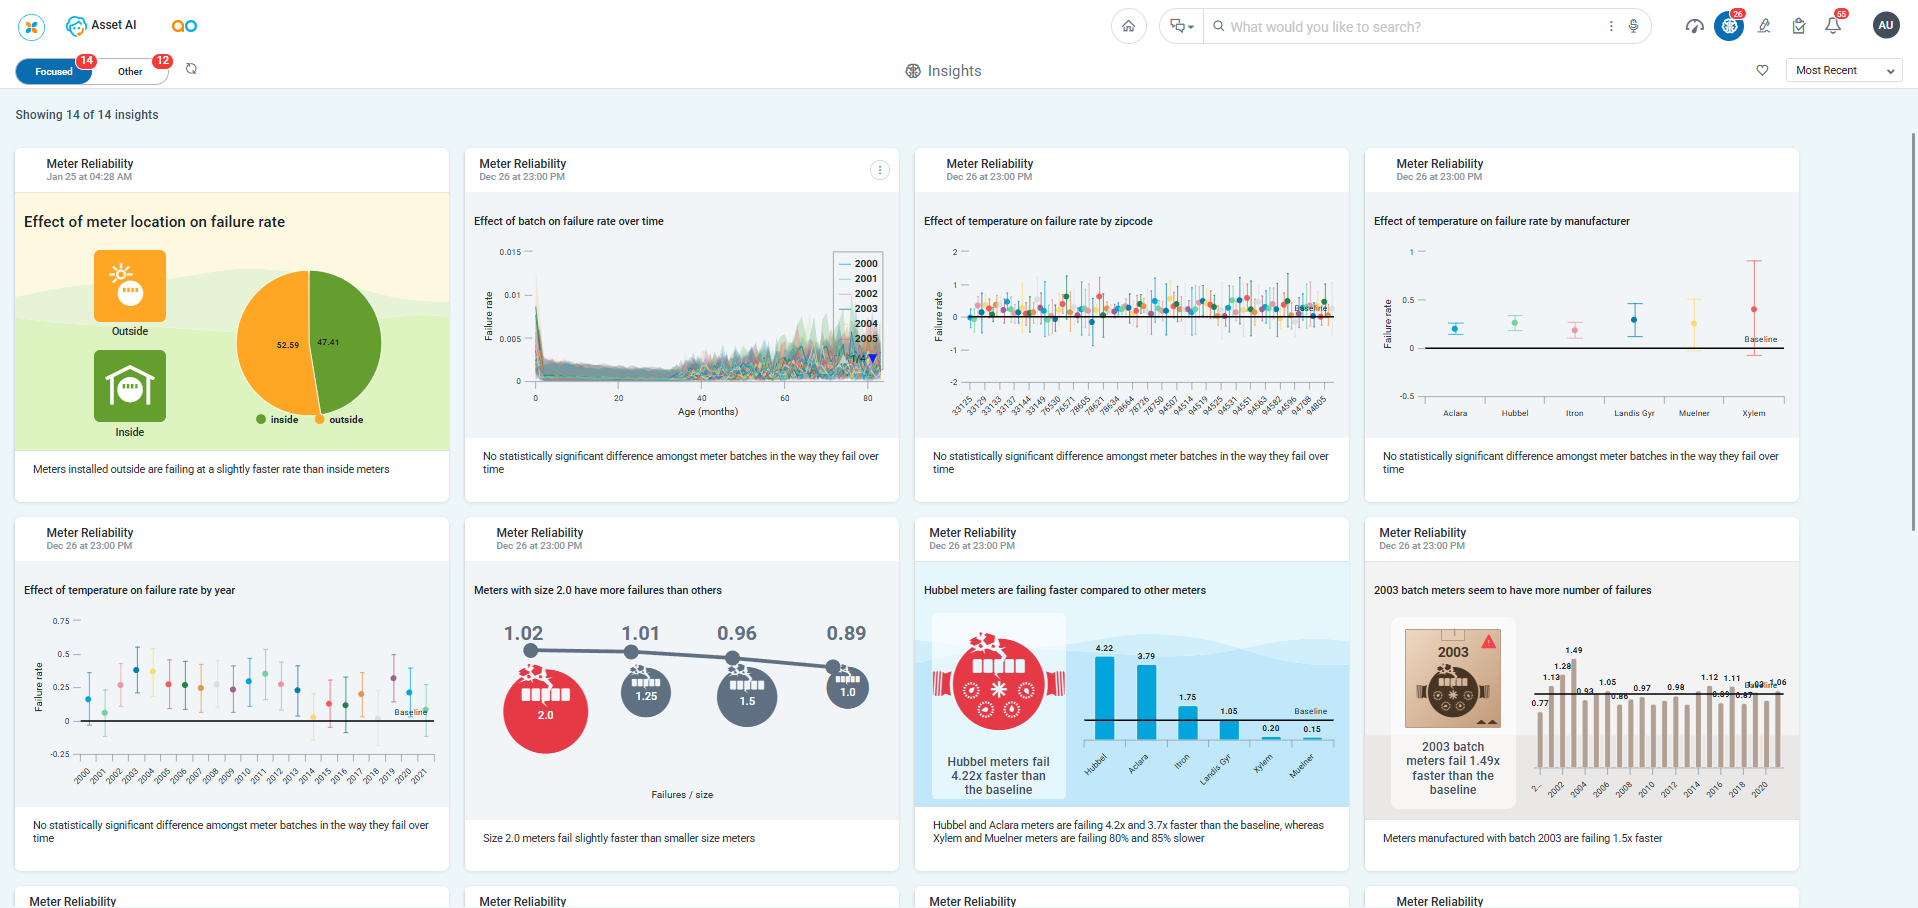
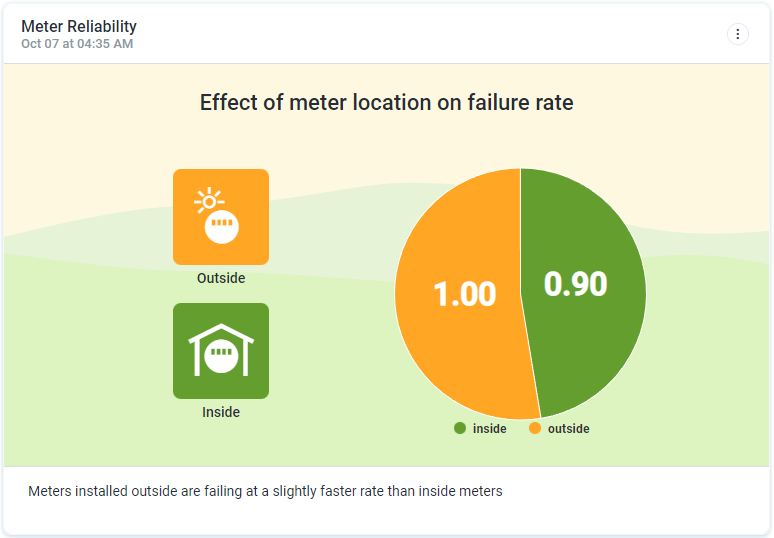
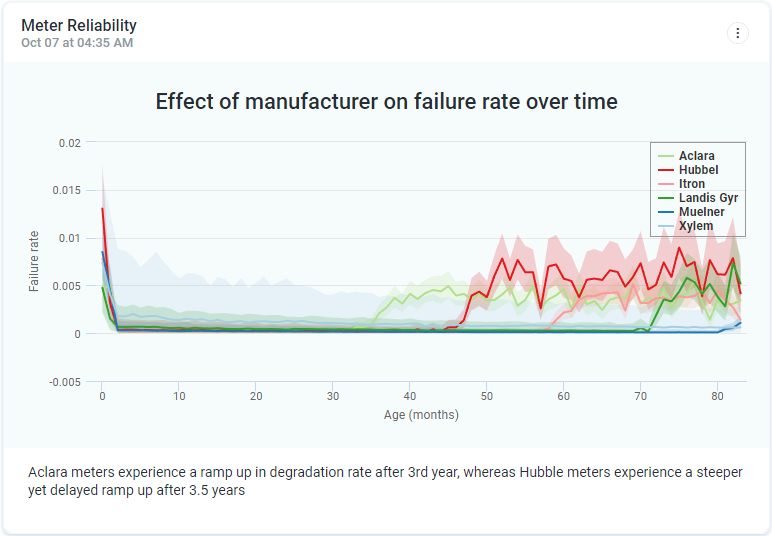
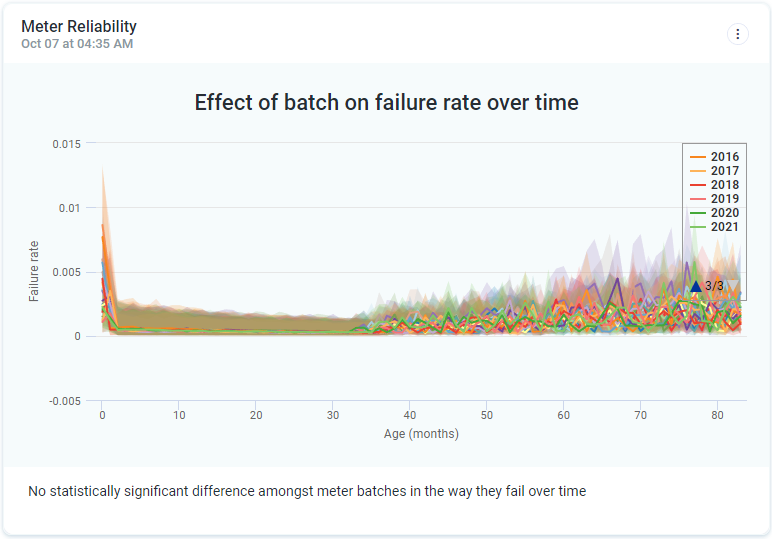
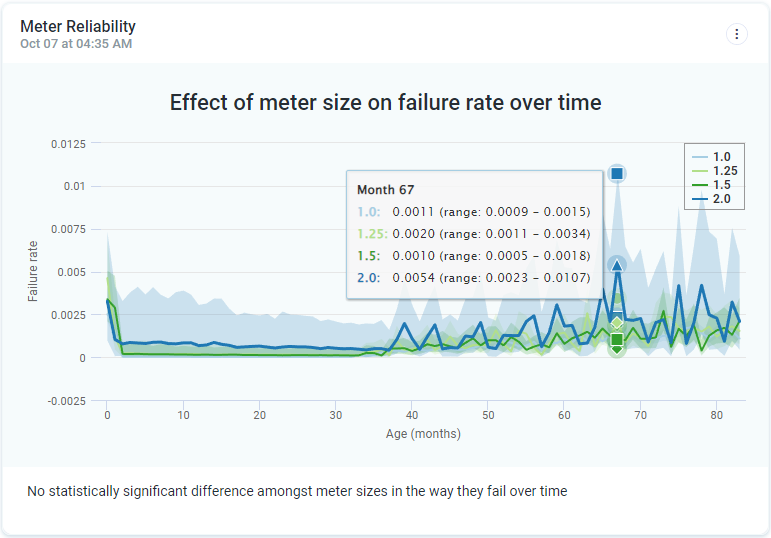
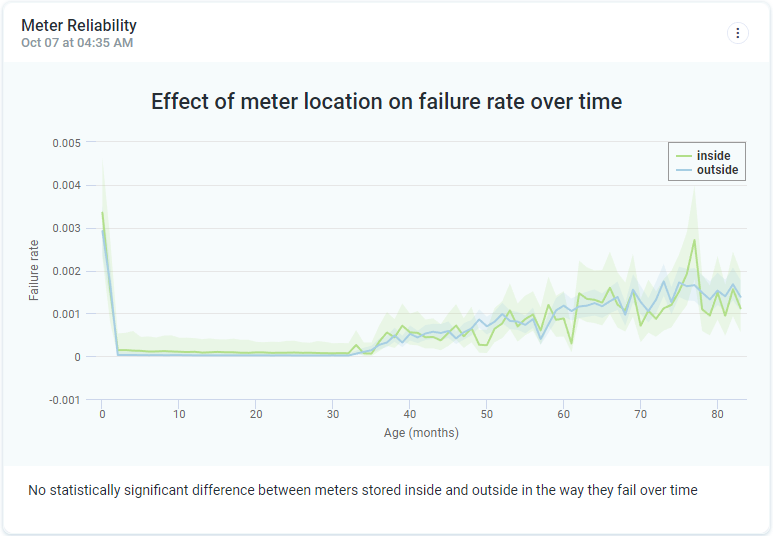
Insights Examples from a Utility Assets Ontology
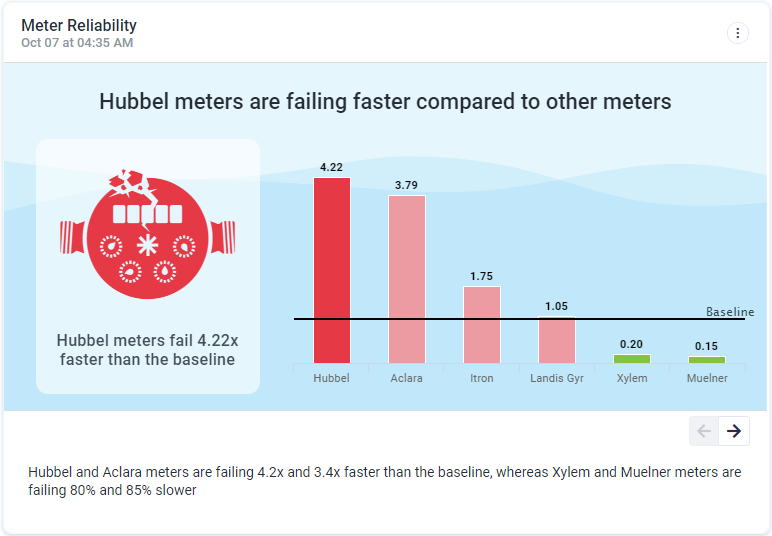
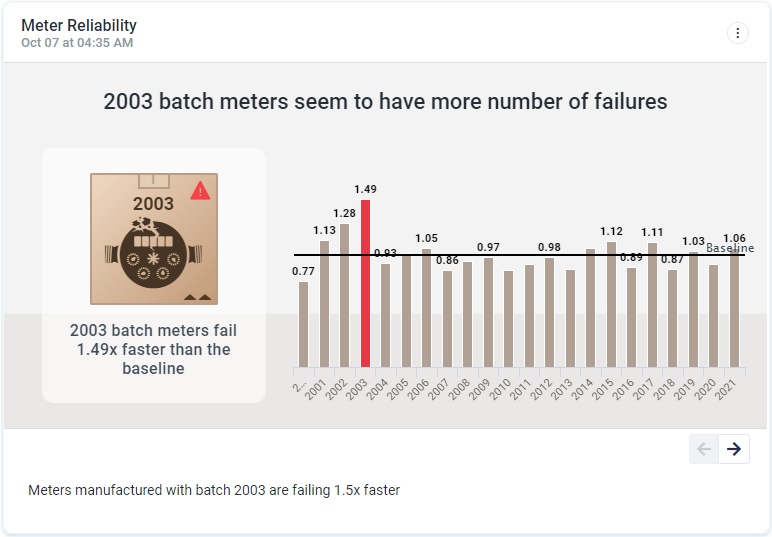
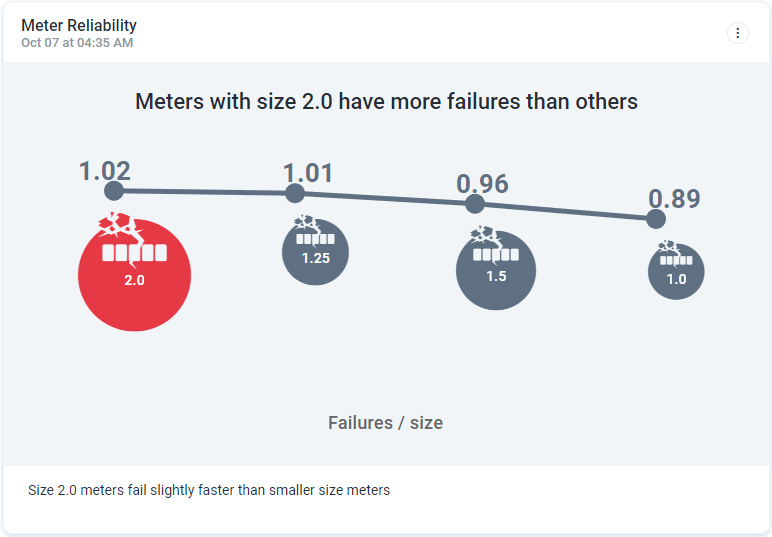
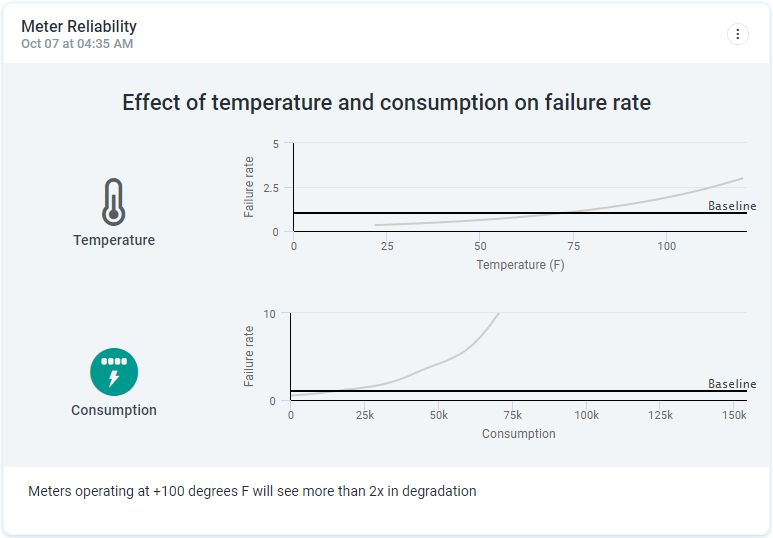
Insights based on specific elements of ontology (Meter failures) | ||
|---|---|---|
 |  |  |
 |  |  |
 |  |  |
 |  |  |
 | ||
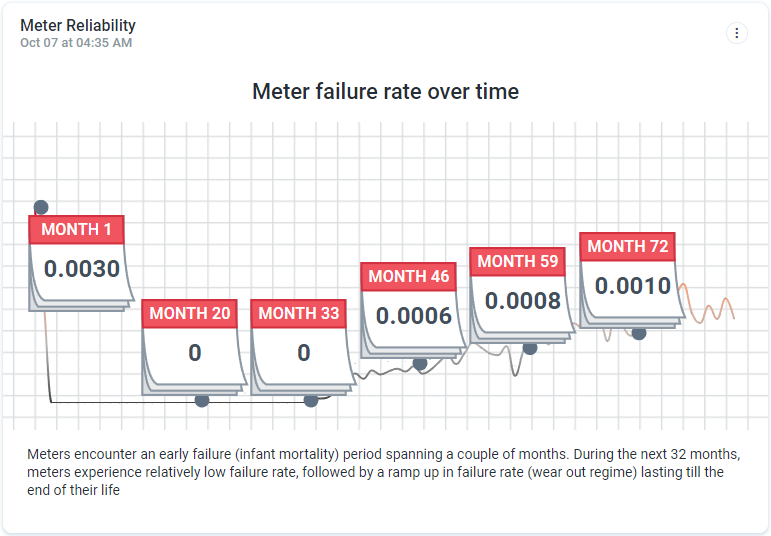
Insights based on a specific data point from an element in ontology (a specific Meter ID) | ||
 |  |  |