Test for Means - One Sample T-Test
Intended audience: END-USERS DATA SCIENCE DEVELOPERS
AO Easy Answers: 4.3
Overview

T-Test analysis refers to a statistical comparison used to determine if there is a significant difference between the means of two groups.
Purpose
The One-Sample T-Test is a statistical tool used to compare the mean of a single sample to a known or hypothesized population mean, helping businesses determine if a specific data set significantly deviates from the expected value.
Business Example
Consider a company that processes Almonds and is interested in determining if the average production volume for Almonds meets the target production level. The company aims to verify if their production is on track compared to the expected average.
Scenario
The company sets a target monthly production volume for Almonds at 500 pounds. To validate whether their actual production aligns with this target, they collect data over a sample period of 30 days, showing that the average production is 520 pounds.
By conducting a One-Sample T-Test, the company can assess whether the observed average production of 520 pounds is significantly different from the target of 500 pounds, or if the variation can be attributed to random fluctuations in the production process.
Results
If the One-Sample T-Test reveals a significant difference, it indicates that the average production is consistently higher than the target, prompting the company to investigate and potentially optimize their production process. If the result is not significant, it suggests that any observed difference in production is due to normal variation, implying that the production process is performing as expected.
Data Sample
ID | Production Volume |
|---|---|
1 | 50.99343 |
2 | 49.72347 |
3 | 51.29538 |
4 | 53.04606 |
5 | 49.53169 |
6 | 49.53173 |
7 | 53.15843 |
8 | 51.53487 |
9 | 49.06105 |
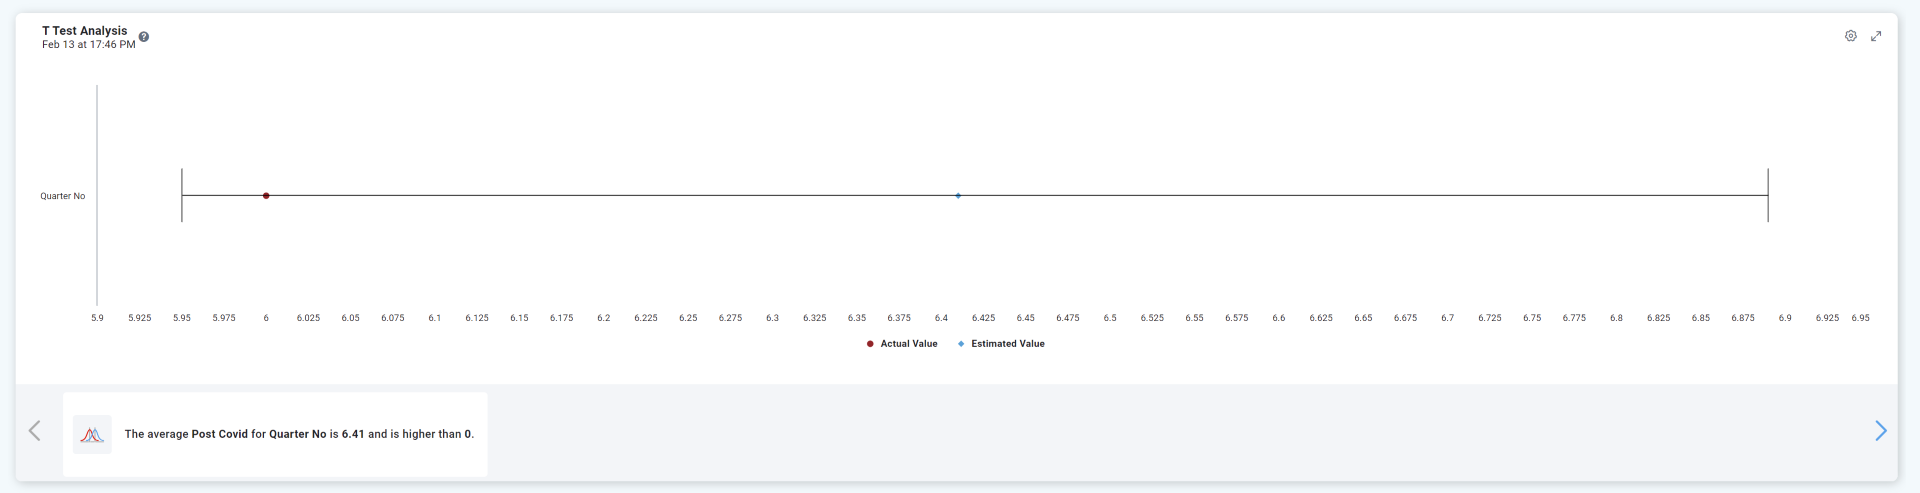
Infographics Insight
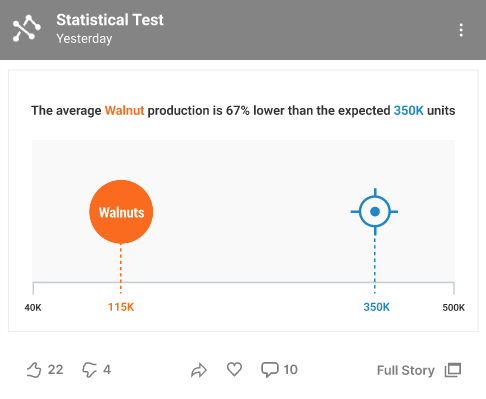
Full Story Insight