Test for Means - Two Sample T-Test / AB Test
Intended audience: END-USERS DATA SCIENCE DEVELOPERS
AO Easy Answers: 4.3
Overview

T-Test analysis refers to a statistical comparison used to determine if there is a significant difference between the means of two groups.
Purpose
The 2-Sample T-Test is a statistical method used to compare the means of two independent samples to determine if there is a significant difference between them. This test is crucial for evaluating whether two different groups or conditions produce significantly different results, providing insights into potential variations or improvements.
Business Example
Consider a company that processes two types of nuts: Almonds and Walnuts. The company is interested in understanding whether the average production volume of Almonds differs significantly from that of Walnuts. To make this assessment, they collect production data from two separate samples—one for Almonds and one for Walnuts.
Scenario
The company wants to compare the average monthly production volumes of Almonds and Walnuts to determine if there is a significant difference between the two. They gather production data for each type of nut over a sample period of 30 days. For instance, they collect data showing that the average production of Almonds is 520 pounds, while the average production of Walnuts is 480 pounds.
By conducting a 2-Sample T-Test, the company will compare the average production volumes of the two nuts to assess whether the observed difference is statistically significant or if it could be attributed to random variation.
Results
If the 2-Sample T-Test reveals a significant difference, it indicates that the average production volumes of Almonds and Walnuts differ statistically. This result could lead the company to investigate factors influencing production differences or to adjust resource allocation. If the result is not significant, it suggests that any observed differences in production volumes are within normal variability, indicating that both types of nuts are produced at comparable levels.
Data Sample
Nut Type | Production Volume |
Almonds | 586.9943 |
Almonds | 590.788 |
Almonds | 547.8497 |
Almonds | 514.0295 |
Walnuts | 487.6925 |
Walnuts | 441.9273 |
Walnuts | 481.5387 |
Walnuts | 484.3702 |
Walnuts | 389.7422 |
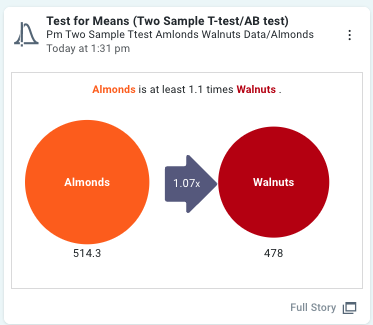
Infographics Insight
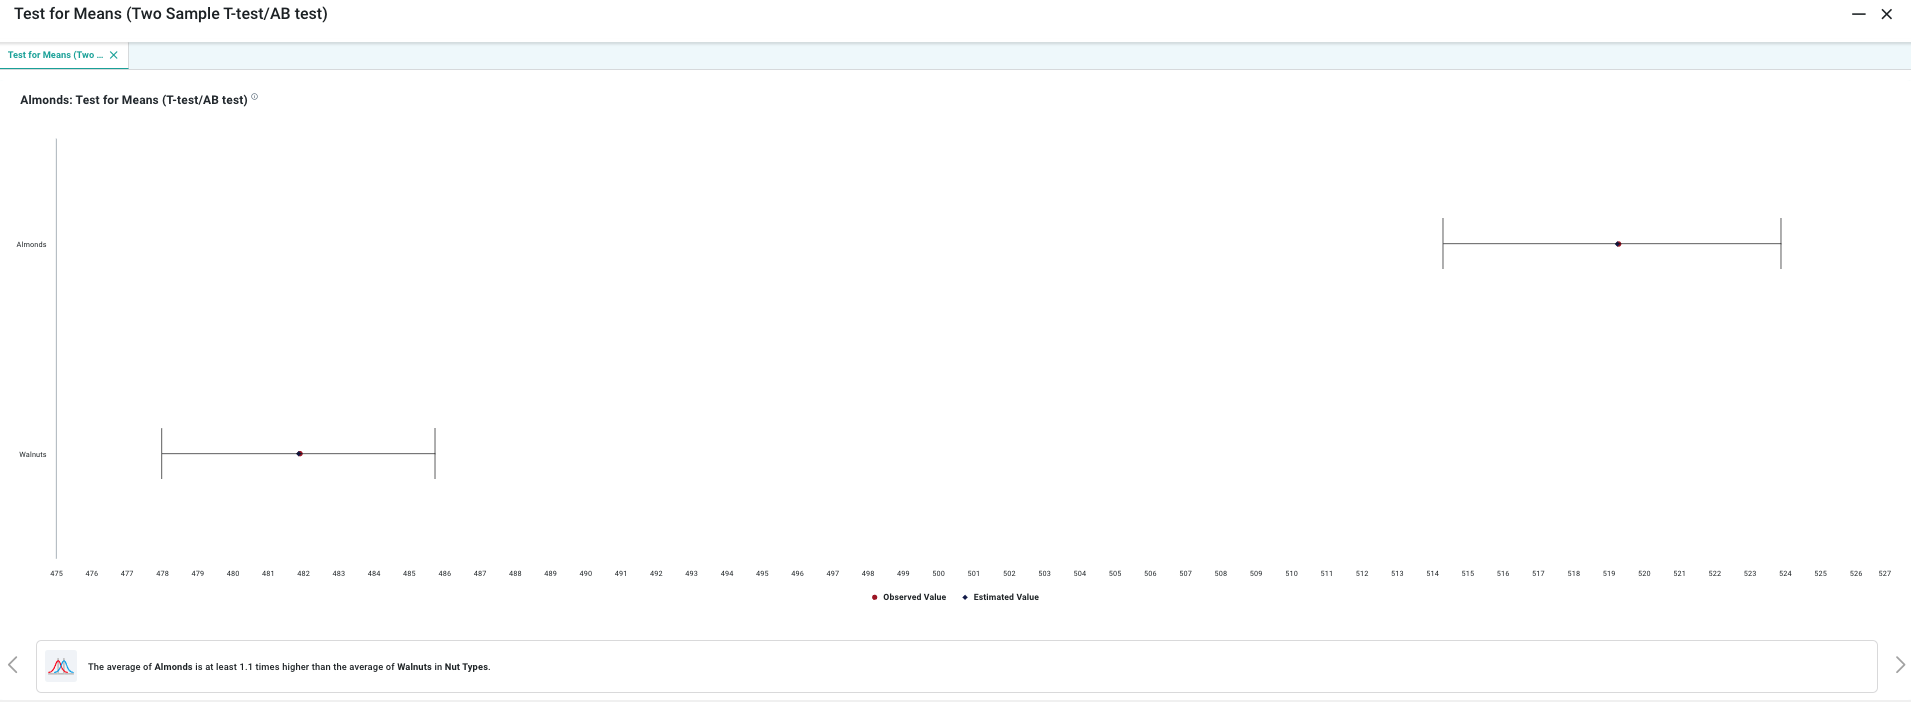
Full Story Insight
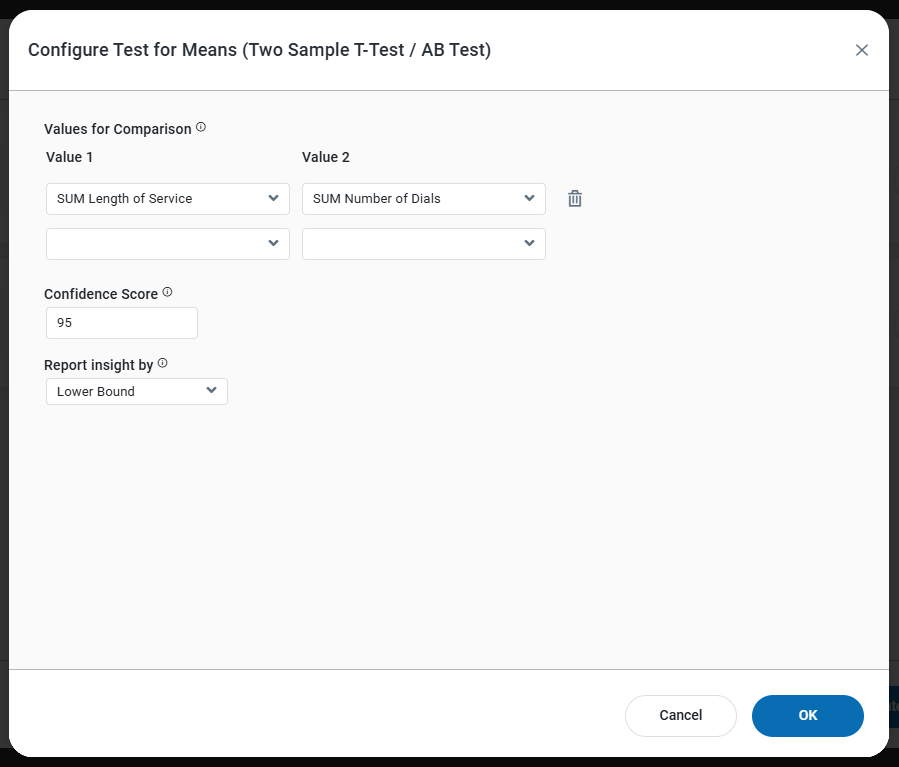
End User Configuration - using Easy Answers solution