Test for Rates - Binomial Test - 2 Series Group Comparison (Compare Group-1 with Sum of Group-1 and 2)
Intended audience: END-USERS DATA SCIENCE DEVELOPERS
AO Easy Answers: 4.3
Overview

The binomial analysis compares the values (count) of two categories to identify items that are significantly different from each other.
Purpose
The comparison helps determine if one brand's sales are noticeably better than another's across different age groups. It’s useful for understanding which brand performs better and whether the differences are meaningful.
Business Example
Imagine a mobile retailer comparing the sales of Apple and Samsung smartphones. They want to know if Apple consistently outsells Samsung in different age groups or if the differences are just by chance.
Scenario
The retailer has historical sales data broken down by age groups. They want to compare this data to see if one brand's sales are significantly higher. For instance, if 60% of the sales among young adults are Apple and 40% are Samsung, they want to know if this difference is substantial or just random.
To find out, they'll compare the sales of Apple and Samsung across each age group, treating higher sales as a better outcome.
Results
If the comparison shows a significant difference, it suggests that one brand is genuinely more popular in certain age groups, which may lead the retailer to adjust their marketing strategies accordingly. If not, the difference might just be due to chance, and no major changes are needed.
Data Sample
Age Group | Apple | Samsung |
|---|---|---|
<20 | 70 | 16 |
20-25 | 40 | 98 |
26-30 | 92 | 106 |
31-35 | 37 | 125 |
36-40 | 108 | 74 |
41-45 | 79 | 85 |
46-50 | 33 | 58 |
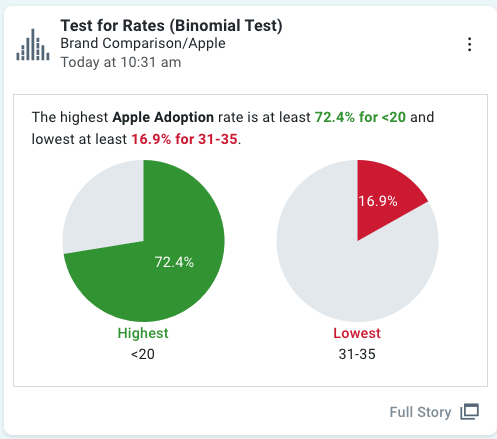
Infographics Insight
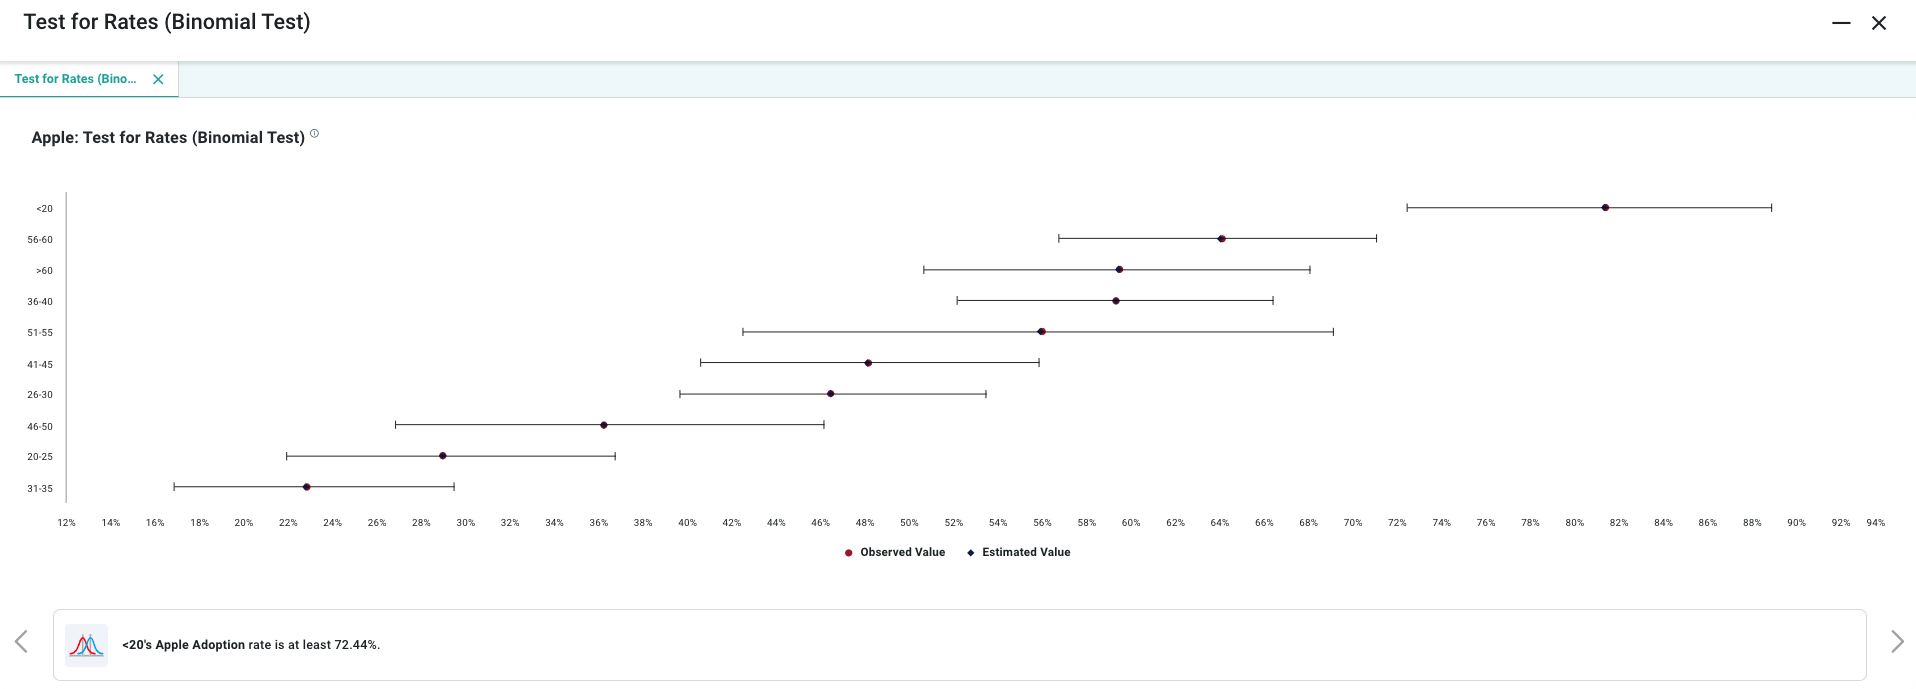
Full Story Insight
End User Configuration - using Easy Answers solution