Trend Line
Intended audience: END-USERS DATA SCIENCE DEVELOPERS
AO Easy Answers: 4.3
Overview

Values trending in a time series may have repeating patterns that occur at regular intervals. This insight identifies the repeating patterns and the intervals in which they occur.
Values in a time series may trend upwards or downwards over time. This insight identifies the direction and slope of a linear trend in the data over time. This Quick Insight also generates the Periodic Estimations (Seasonality) output.
Purpose
Understand the overall direction of product sales over time to make informed business decisions.
Business Example
Evaluating the long-term performance of a product to guide marketing and production strategies.
Scenario
A retail company wants to analyze the sales of one of its products to determine whether sales are generally increasing, decreasing, or staying consistent. Understanding this trend is crucial for the company to forecast future demand, manage inventory levels, and adjust marketing strategies.
For instance, if sales have been steadily rising, the company might consider increasing production or investing more in marketing to further boost sales. Conversely, if sales are declining, it could prompt a review of the product's market position, pricing, or promotional strategies.
Results
By tracking and reviewing the sales pattern over time, the company can gain insights into how the product is performing in the market. If the sales are growing, it suggests that demand is increasing, which could justify expanding production or marketing efforts. If the sales are declining, the company may need to address potential issues, such as changes in customer preferences or competitive pressures. If sales remain steady, the company might decide to maintain its current approach. Understanding these trends helps the company make informed decisions that align with the product's market trajectory.
Data Sample
Date | Product_Sales | Inventory_Levels | Marketing_Spend |
|---|---|---|---|
2023-01-01 00:00:00 | 154.9671415 | 569.9677718 | 932.4821725 |
2023-01-02 00:00:00 | 148.7174571 | 546.2316841 | 985.5481329 |
2023-01-03 00:00:00 | 156.6770856 | 502.9815185 | 920.7580079 |
2023-01-04 00:00:00 | 165.5305989 | 467.6531611 | 969.203847 |
2023-01-05 00:00:00 | 148.0588667 | 534.9111657 | 810.6385333 |
2023-01-06 00:00:00 | 148.1591309 | 519.6742693 | 1021.329371 |
2023-01-07 00:00:00 | 166.3927288 | 544.759661 | 1000.120548 |
2023-01-08 00:00:00 | 158.375048 | 531.7585901 | 918.2911369 |
2023-01-09 00:00:00 | 146.1060569 | 552.4776358 | 1065.924567 |
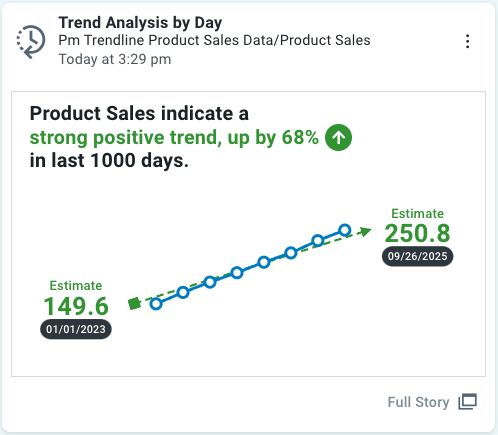
Infographics Insight
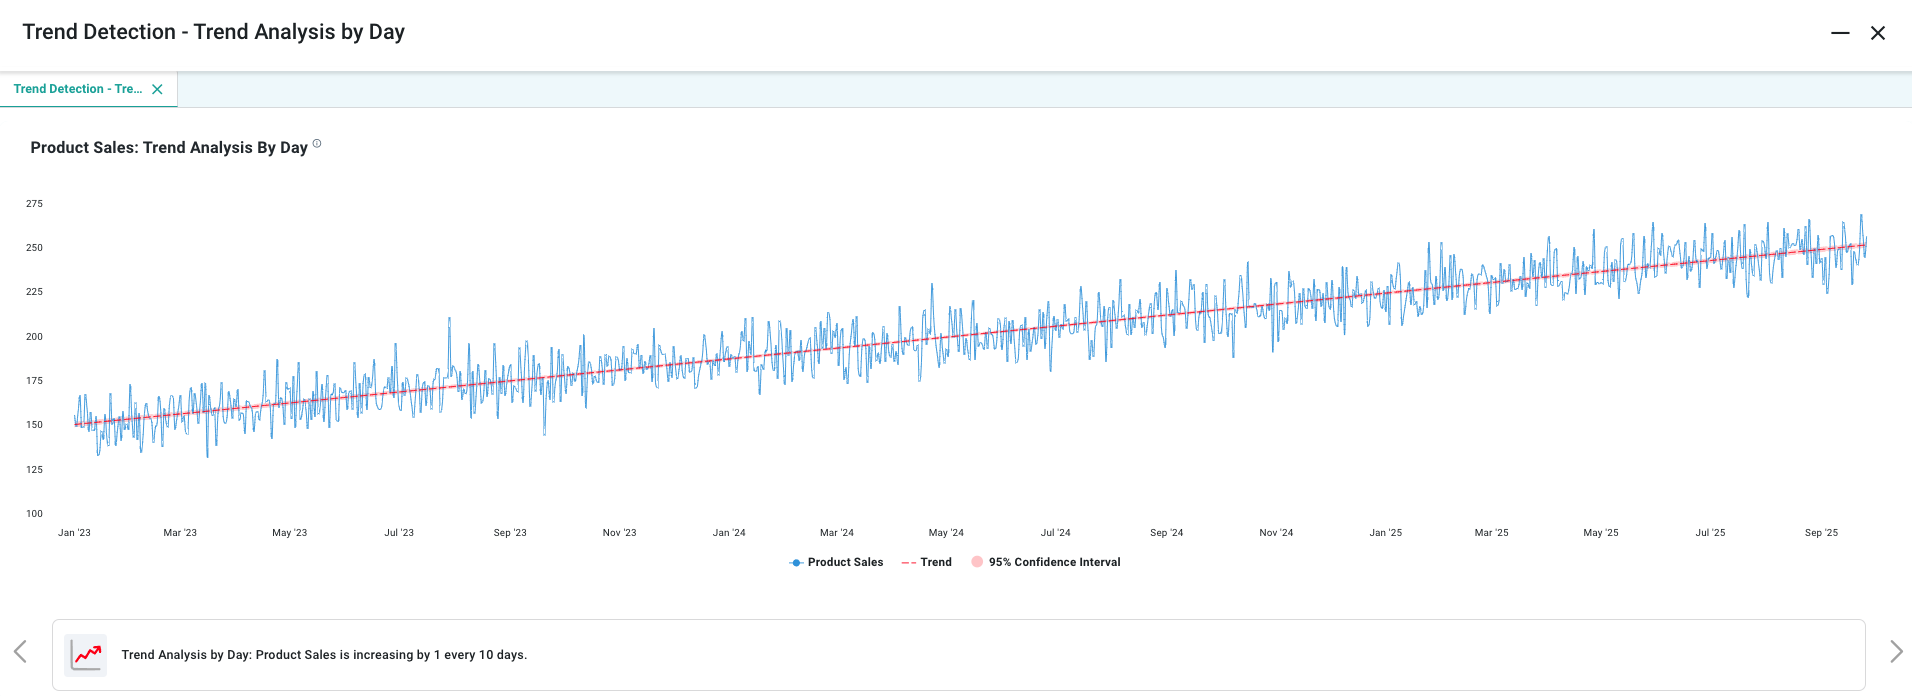
Full Story Insight
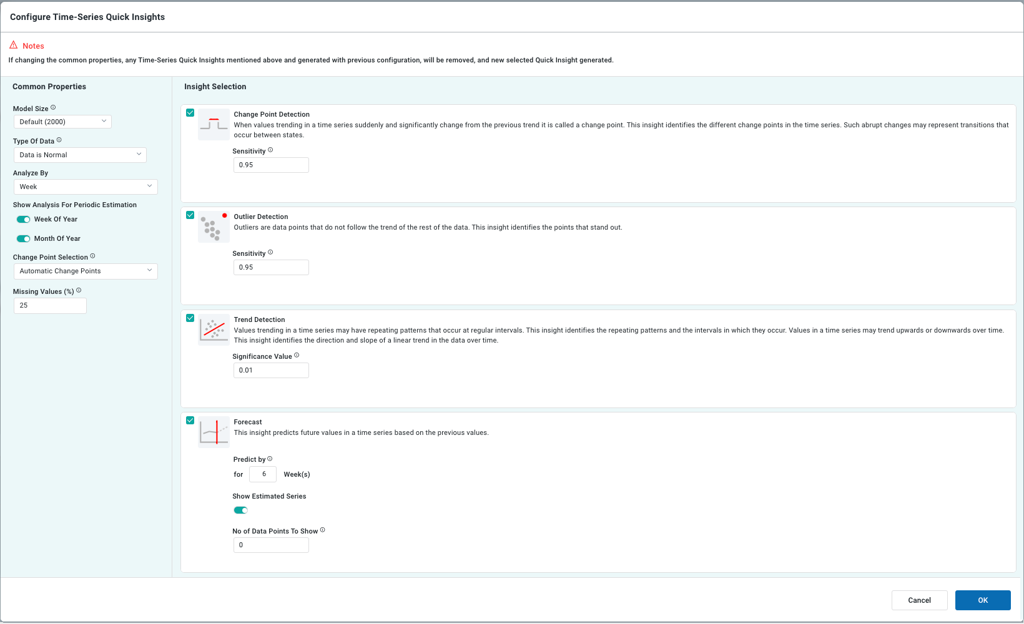
End User Configuration - using Easy Answers solution