AI Response - Table
Intended audience: END-USERS
AO Easy Answers: 4.3
Overview
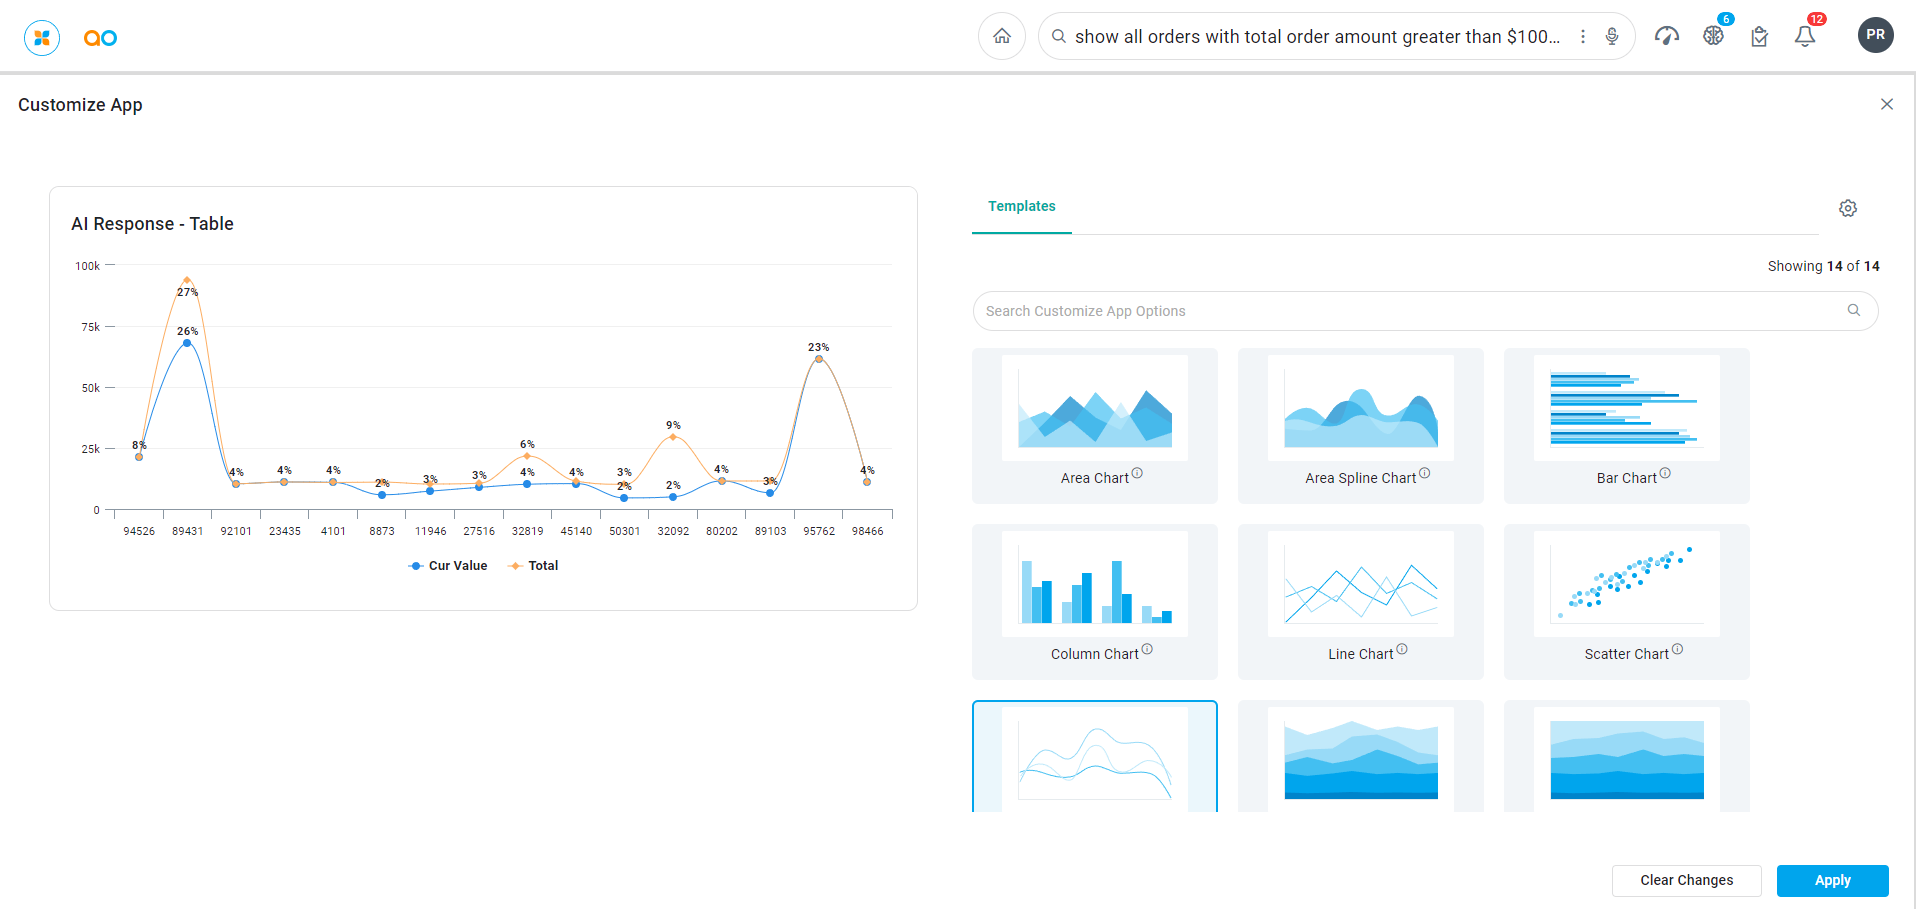
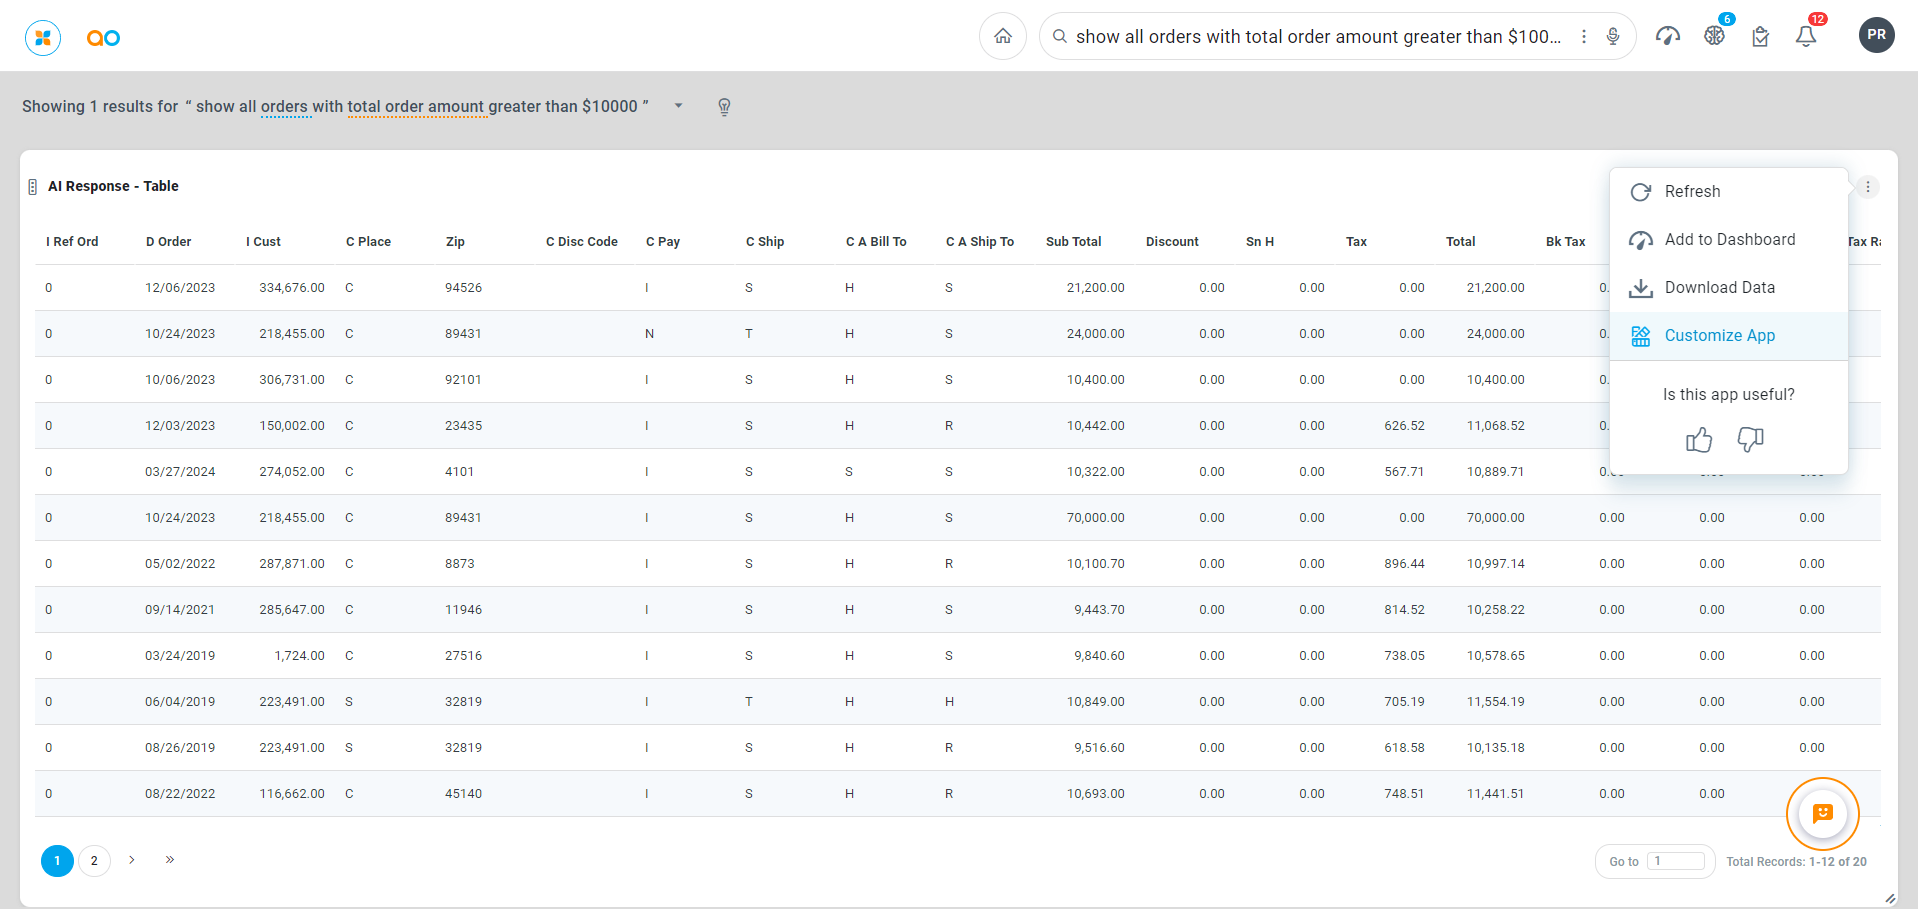
Most data can be presented in many different types of visualizations. Using the Customize App option in the App Options menu, the user will be able to select from one or more alternative visualizations that may suit the data better or just simply be preferred by the user. This page illustrates the options to add Chart visualizations replacing a specific type of App, AI Response Table, which may be displayed as a result of a question asked in Easy Answers using LLM-mode. Such AI Response Table will be shown with formatting and Links if applicable to allow opening the Details popup for individual items. Finally, an AI Response Table can be converted to a Chart App using the Customize App functionality.
Customize App for AI Response Table
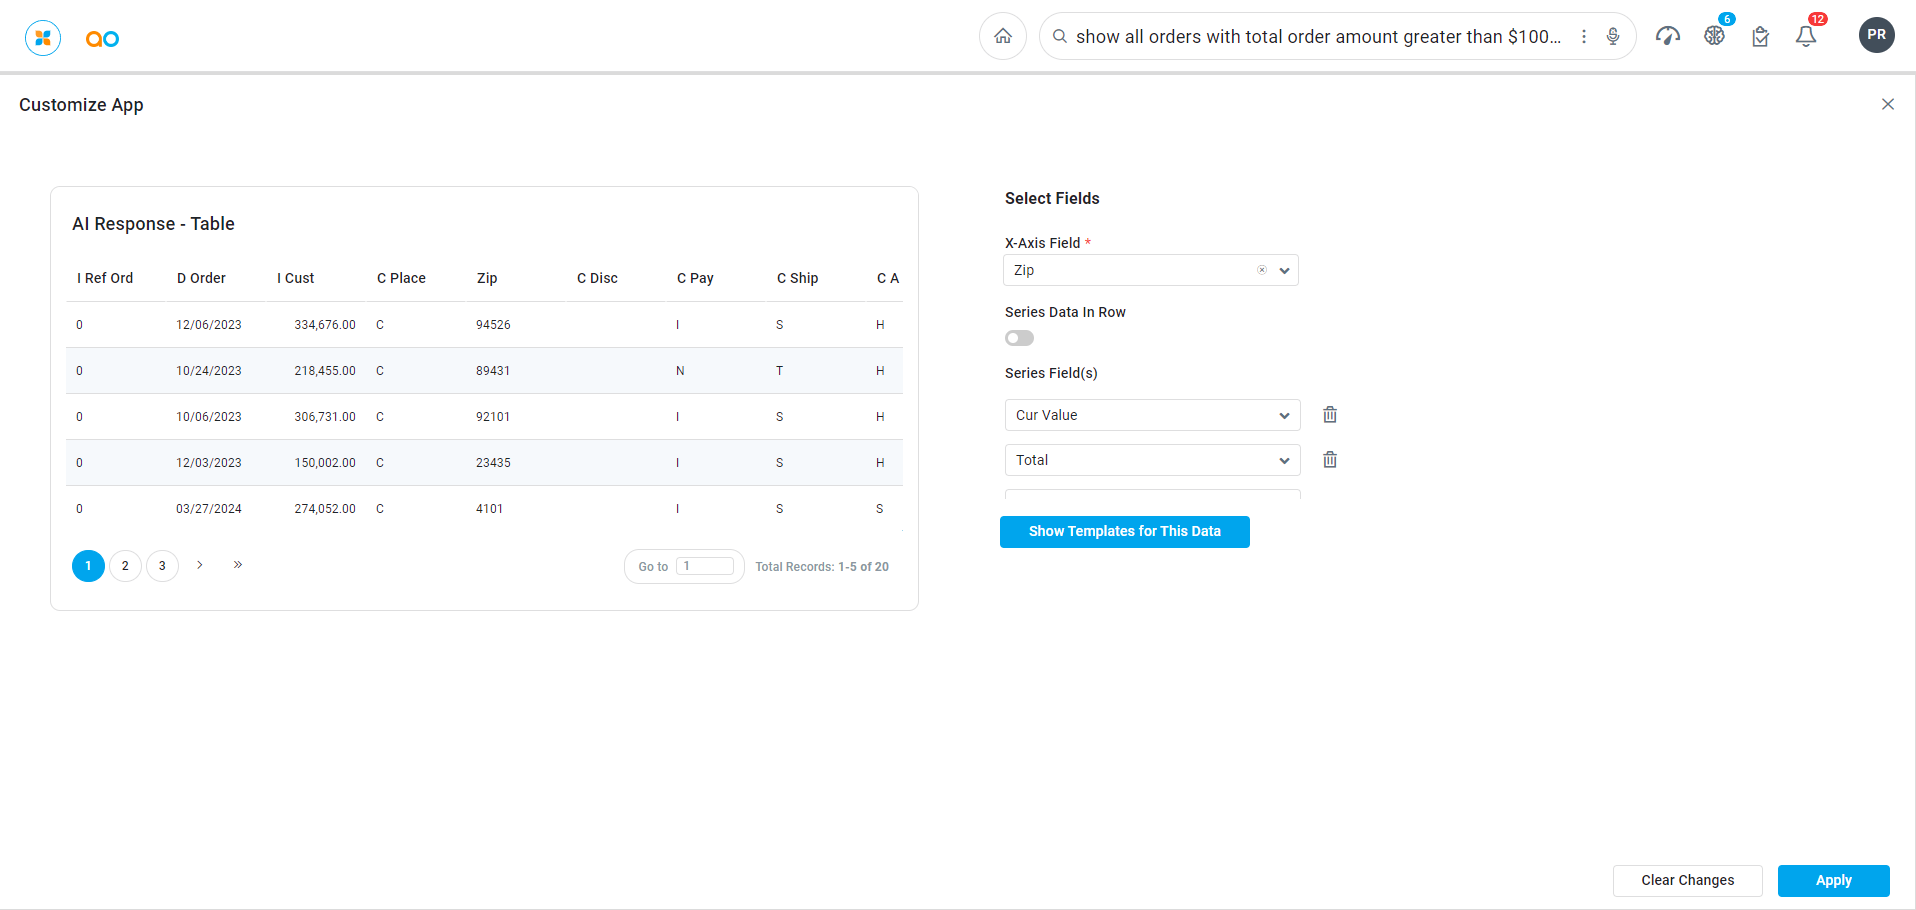
Once the Customize App menu option has been selected from the App Options menu, the popup dialog opens for Customize App showing the AI Response Table with all the columns available.
Select X-Axis and one or more Series Field(s) from the columns in the table
Click the Show Templates for This Data button.
The Chart Templates will show what can be visualized for the selected data.
To go back to the data selection, click the gear icon on the far right of the screen.
Finally, click the Apply button to convert the AI Response Table to the selected Chart visualization on the Results page.