Infographics
Intended audience: END-USERS
AO Easy Answers: 4.3
Overview
Most data can be presented in many different types of visualizations. Using the Customize App option in the App Options menu, the user will be able to select from one or more alternative visualizations that may suit the data better or just simply be preferred by the user. This page illustrates the options to add Infographics style visualizations. Such infographic-style visualizations can be created by the solution developer using the Template Composer in the AO Platform. The list of alternative visualizations for a given App will expand in future releases.
Examples of Infographics Visualizations
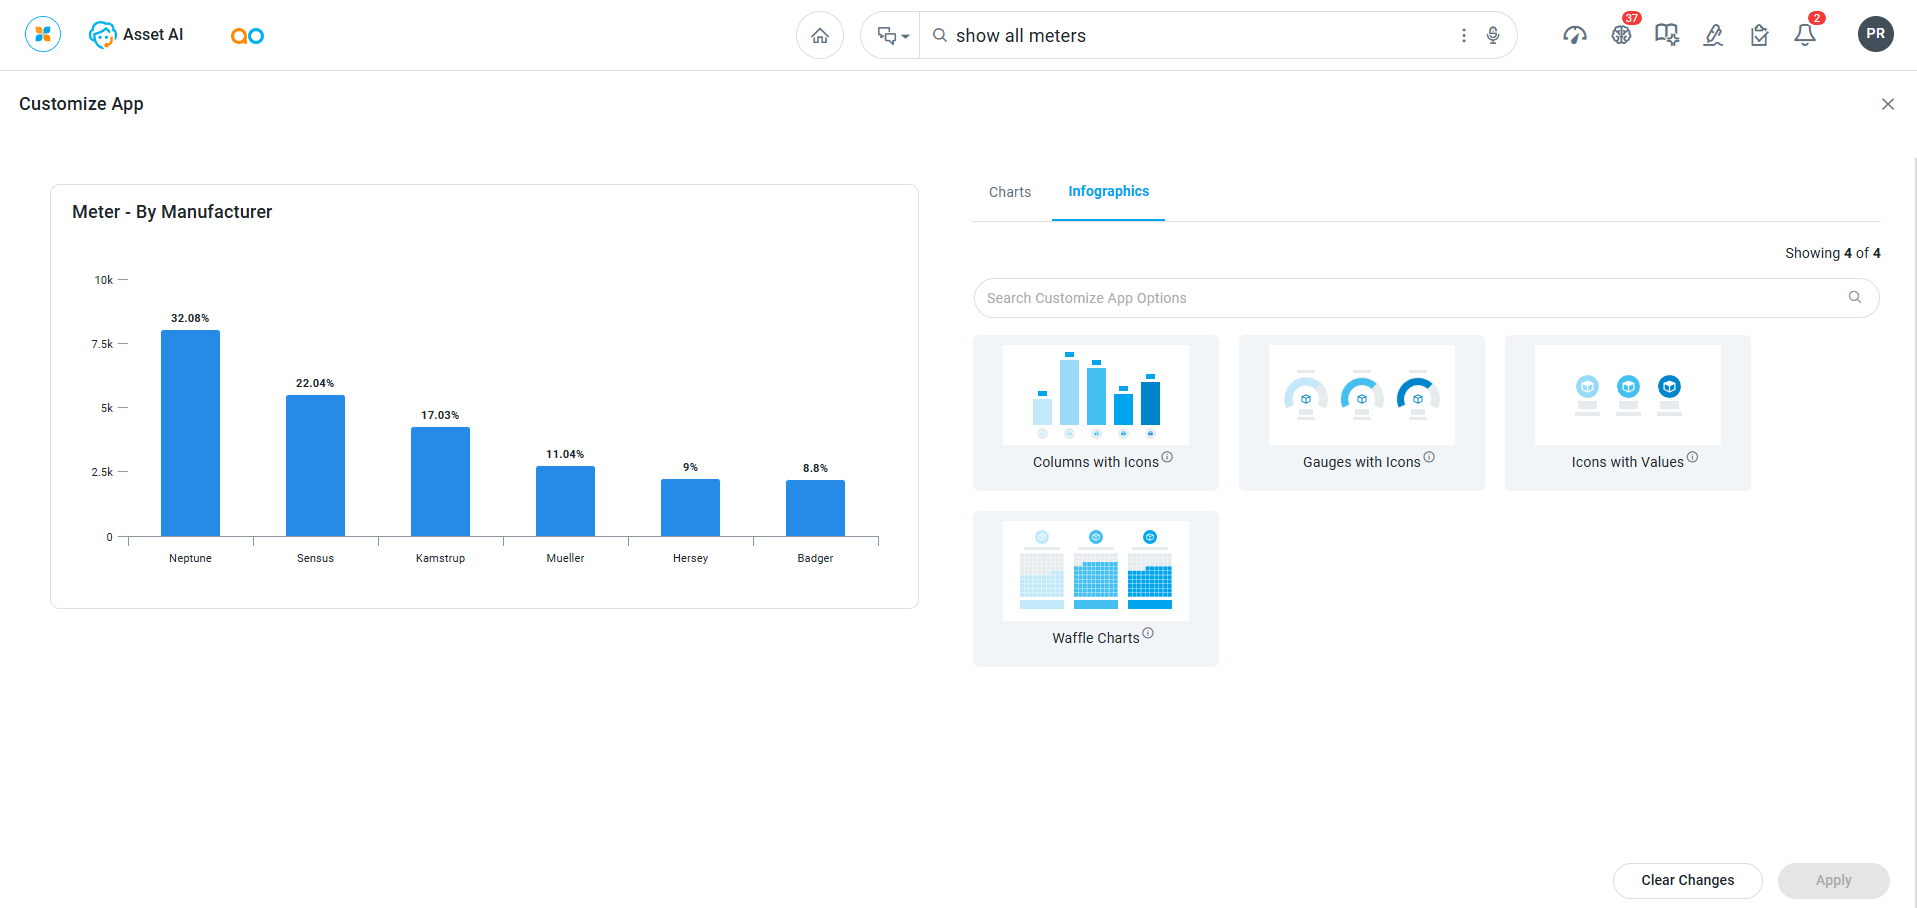
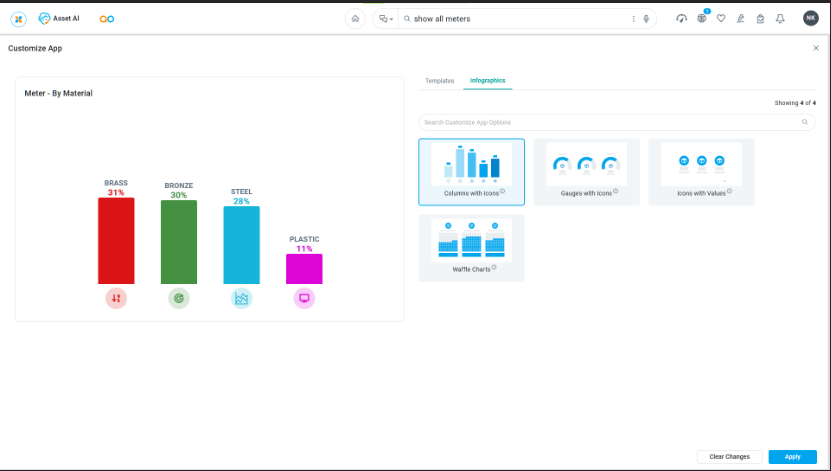
Columns with Icons
Columns with Icons represents different categories with their values and category names, while the associated icons add a symbol (or logo) for each category.
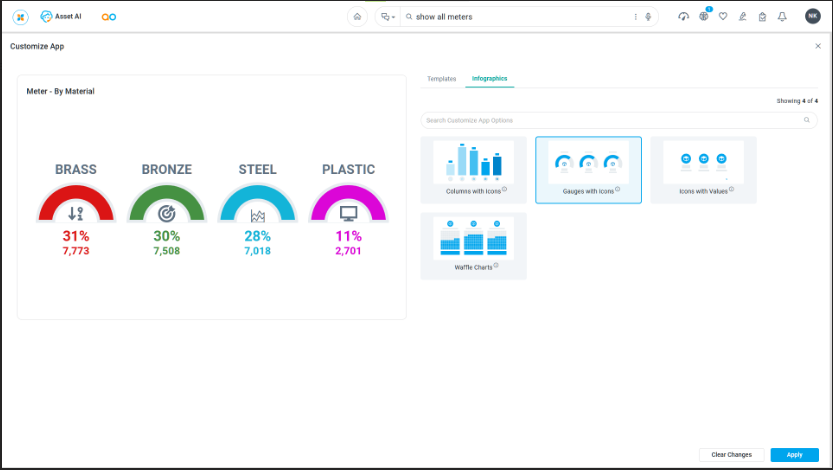
Gauges with Icons
Gauges with Icons display specific metrics or values which represent the scale of a specific category, while the associated icons add a symbol (or logo) for each category.
Icons with Values
Icons with Values represent categories of data through visual symbols (or logos) accompanied by numerical or qualitative indicators.
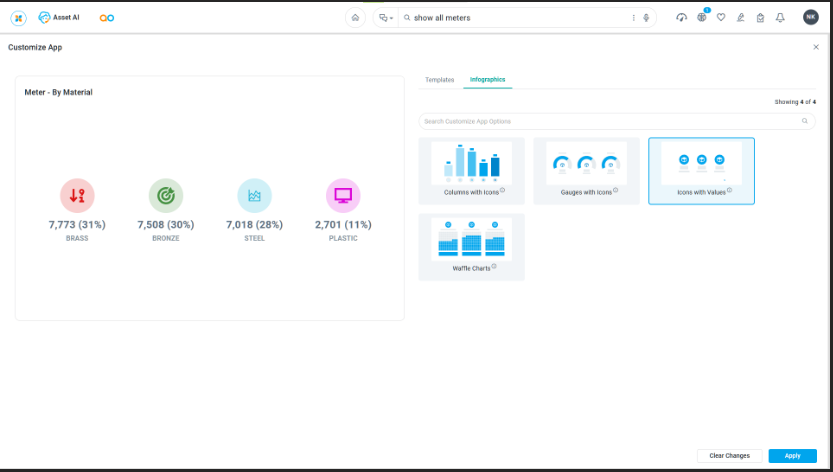
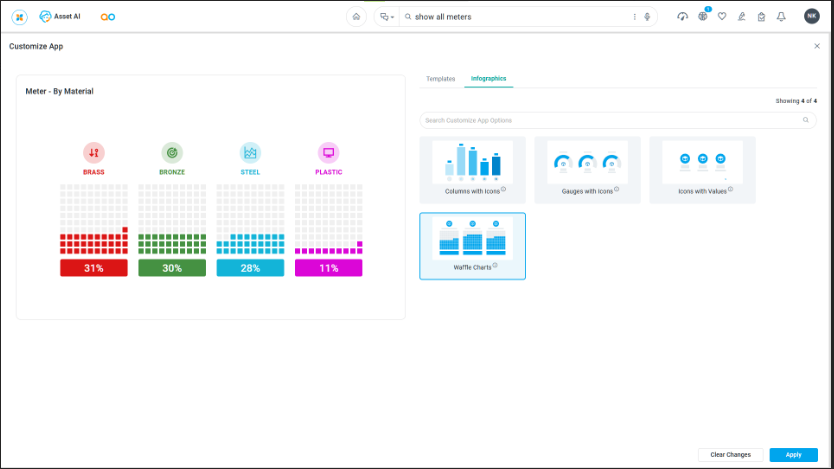
Waffle Charts
The Waffle Charts are utilized to represent categories of data by dividing a grid into smaller units, where each unit represents a proportion or percentage of the whole. The associated icons add a symbol (or logo) for each category.