Quick Insights for Spatial Correlation
Intended audience: END-USERS DATA SCIENCE DEVELOPERS
AO Easy Answers: 4.3
Overview

The Spatial Correlation Quick Insight refers to the relationship between variables that are geographically (or spatially) distributed. It helps us understand how one variable changes in relation to another across different locations.
There are two possible outcomes:
how the target variable is impacted across distance, ie the speed at which some “issue” decays over a geographic distance considering features in a landscape, such as coastline, mountains, rivers, etc…
How the target variable correlates between multiple “issue hotspots”.
The Spatial Correlation Quick Insight can only be generated as a scheduled task created by the Solution Developer using the Insight Composer in the AO Platform. The output from the generated Quick Insight will be added to the Insights page in Easy Answers.
Purpose
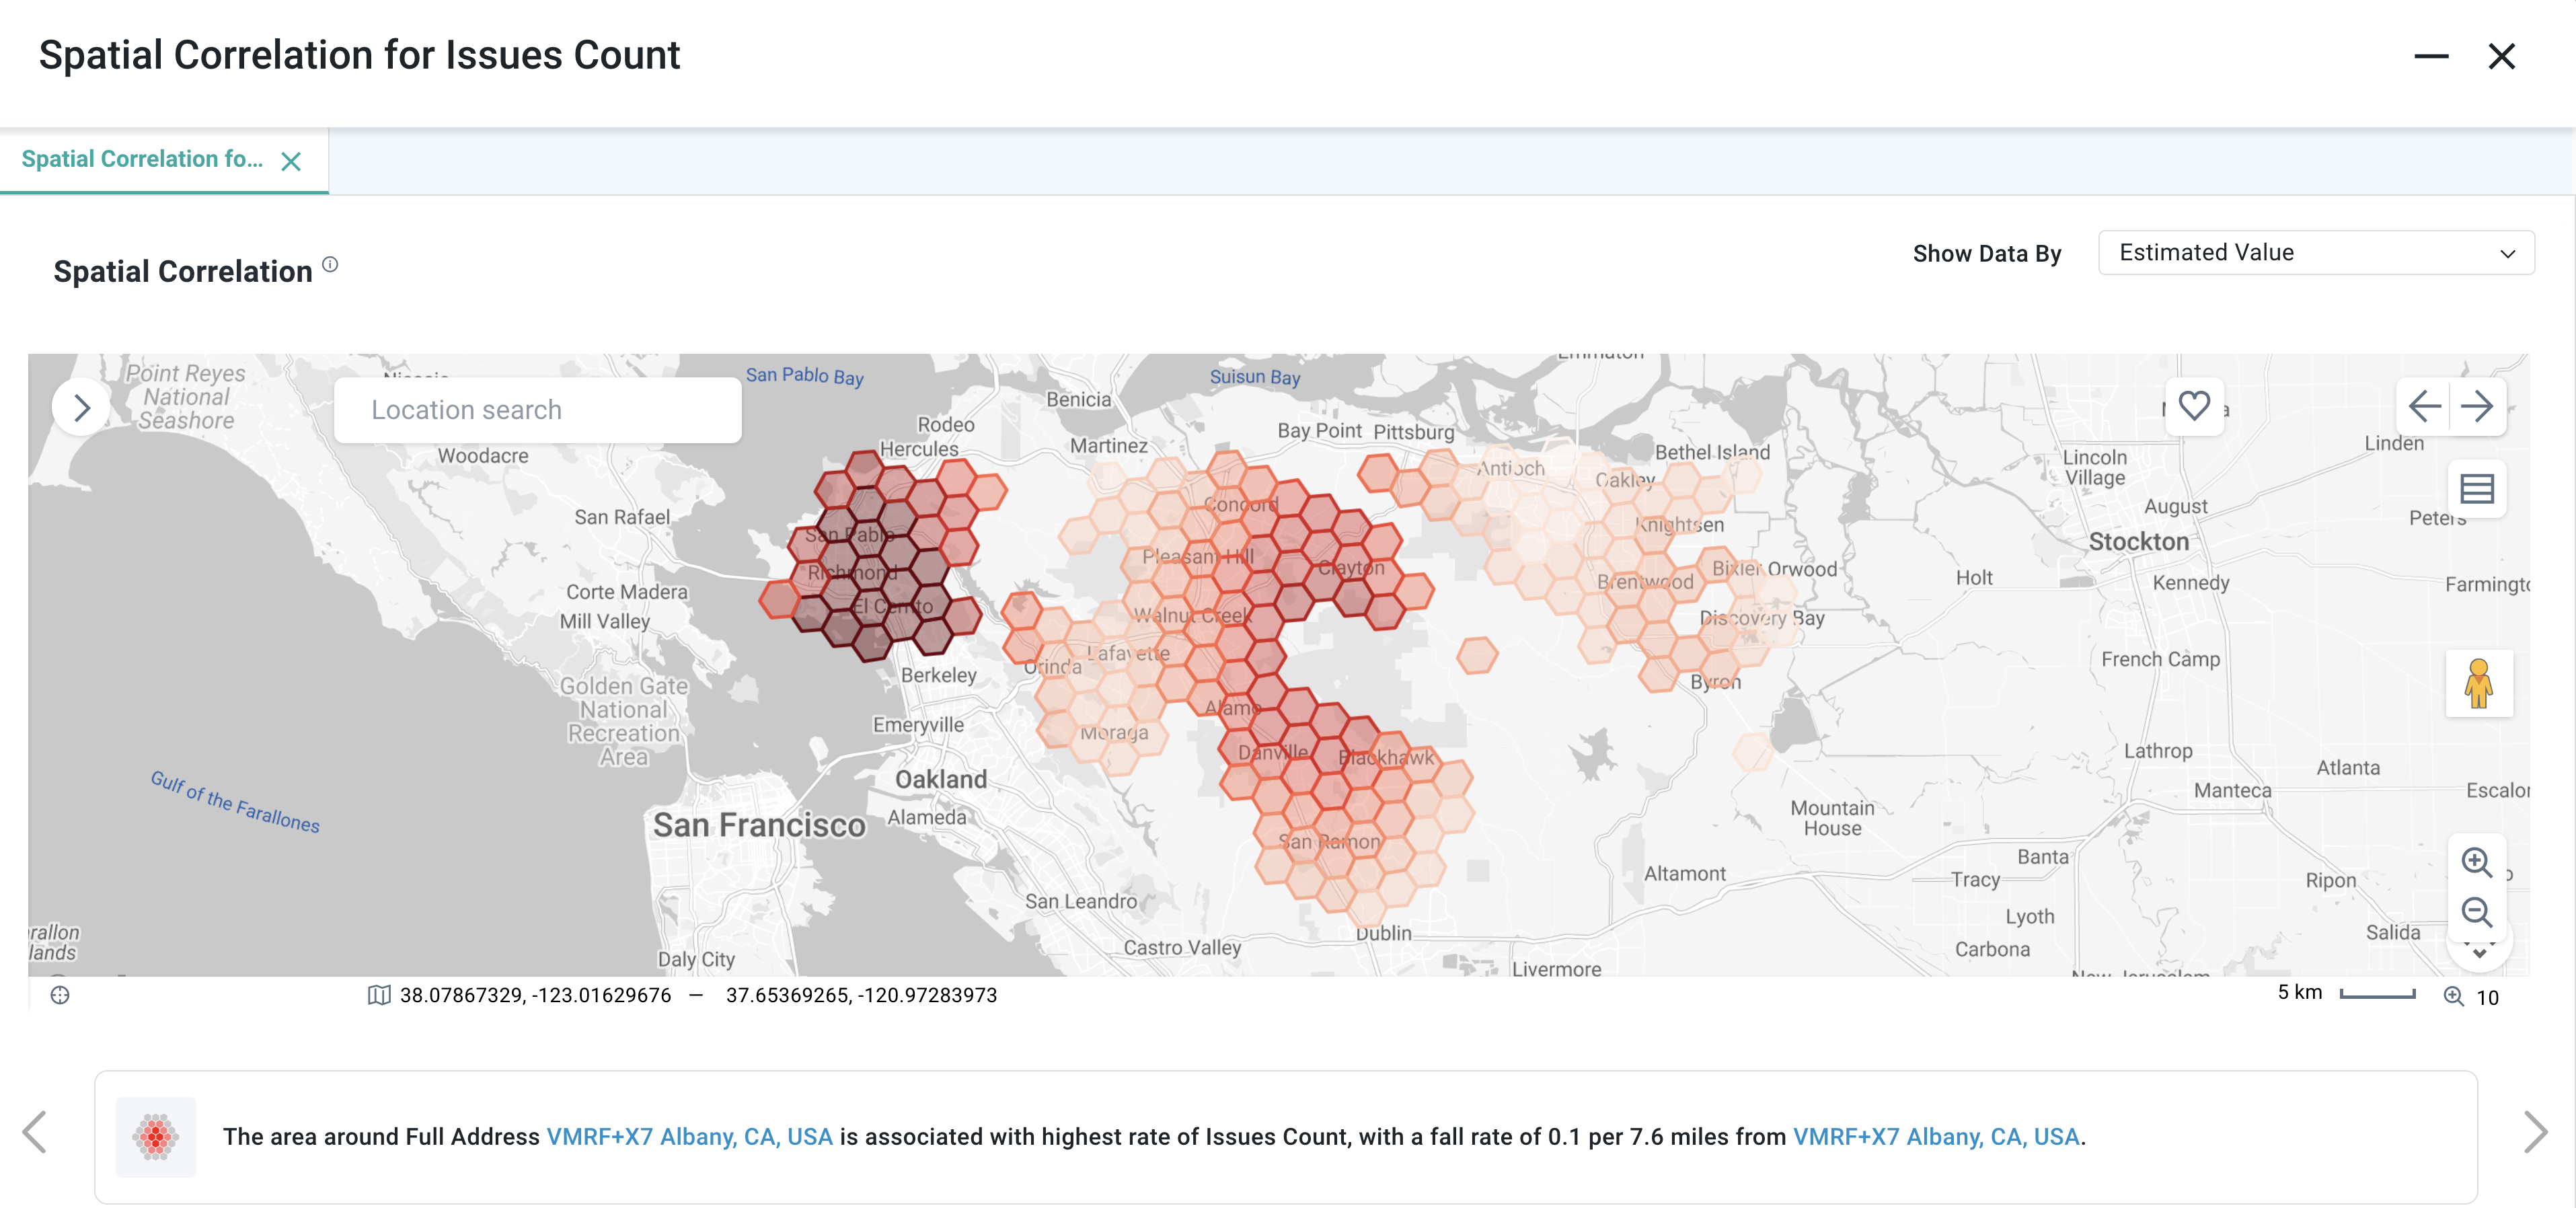
The spatial analysis aims to visualize and analyze the geographical distribution and intensity of meter faults or issues across different spatial resolutions (1-16) or predefined regions (e.g., State, County, Zipcode, or coordinates). This allows utilities or manufacturing businesses to identify problem areas geographically (hotspots) and prioritize targeted interventions, optimize operational planning, and preventive maintenance.
Business Example
A utility company…
needs to analyze meter performance and reliability issues across its service area. By visualizing meter faults spatially at varying resolutions (State → Zipcode → Individual Coordinates), the company can strategically allocate maintenance resources, prioritize areas needing urgent attention, and reduce operational downtime.
wants to assess the geographic concentration of meter issues to identify underperforming areas. By examining faults by regional groupings such as state or county, they can focus maintenance resources and track regional manufacturer performance.
Scenario
Spatial analysis of meter faults is performed based on
Issues Countacross geographic locations.Resolution options allow analysis at multiple geographic levels: State-level overview, Zipcode-level hotspots, and Lat/Lon pinpoint accuracy.
Analyzing spatial patterns of meter faults alongside related variables such as
Age Months,Manufacturer, and environmental factors (Temperature), to understand underlying causes of issues.
Results
Identification of spatial clusters with high meter fault occurrences.
Insight into relationships between geographic location, environmental factors, and meter reliability.
Improved decision-making regarding resource allocation for preventive maintenance and equipment replacements.
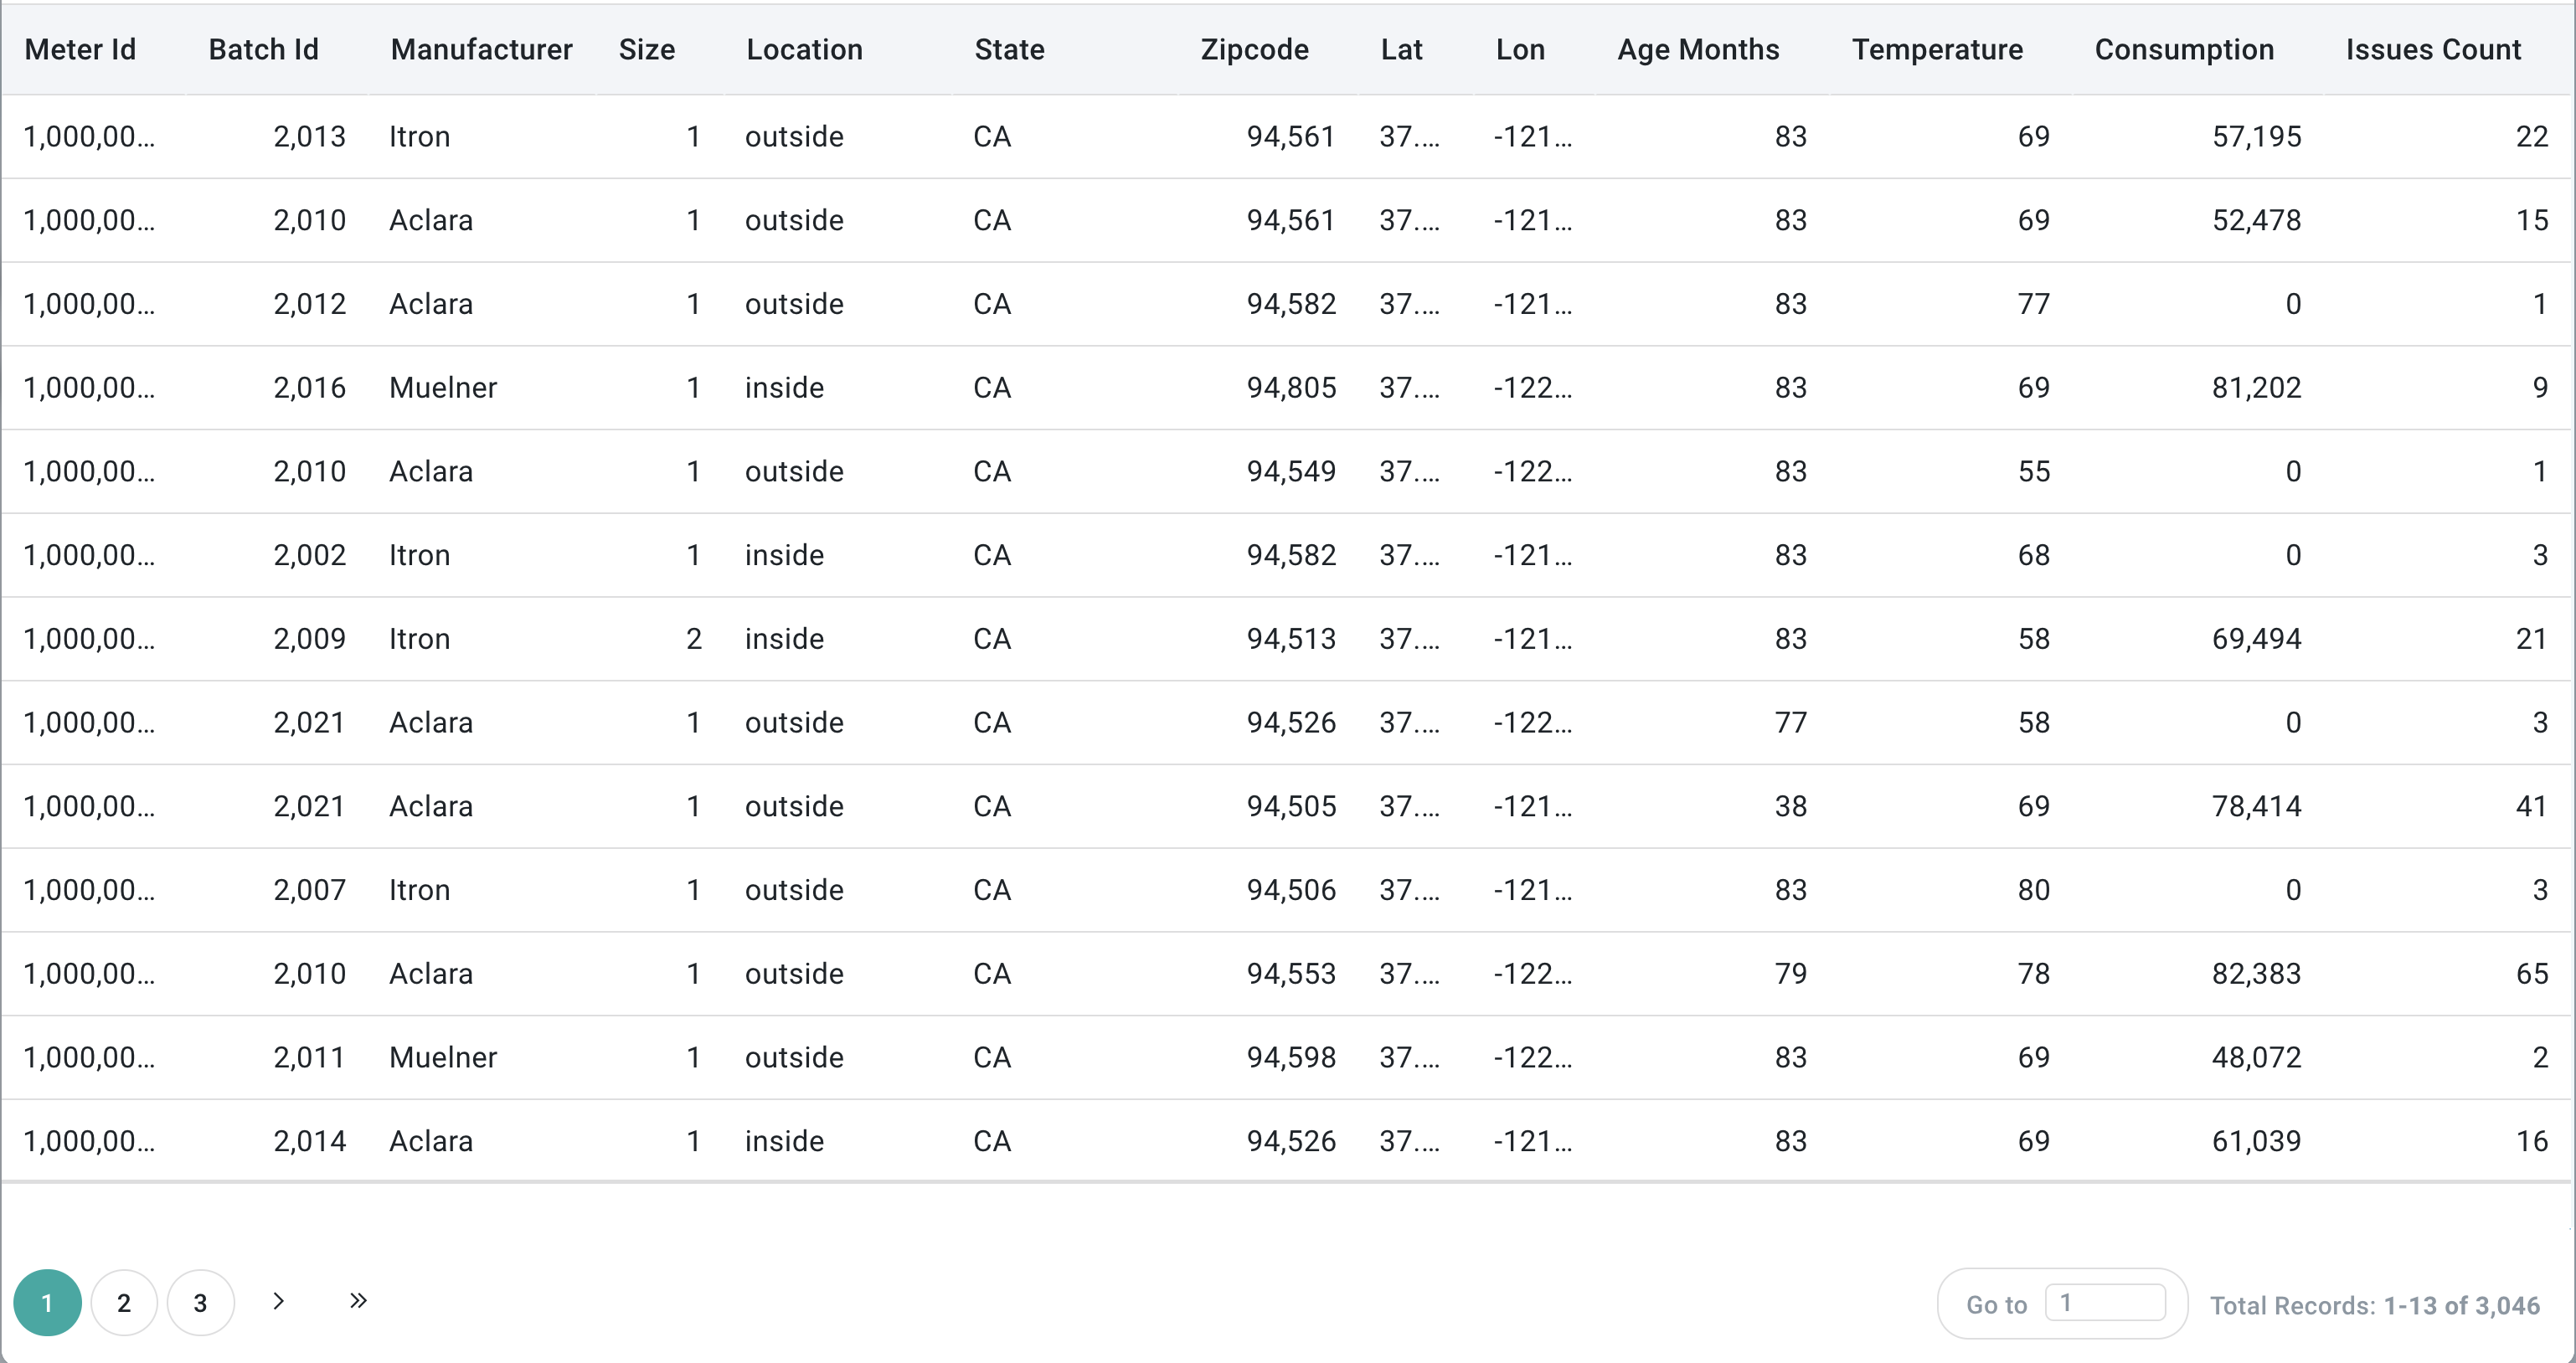
Data Sample
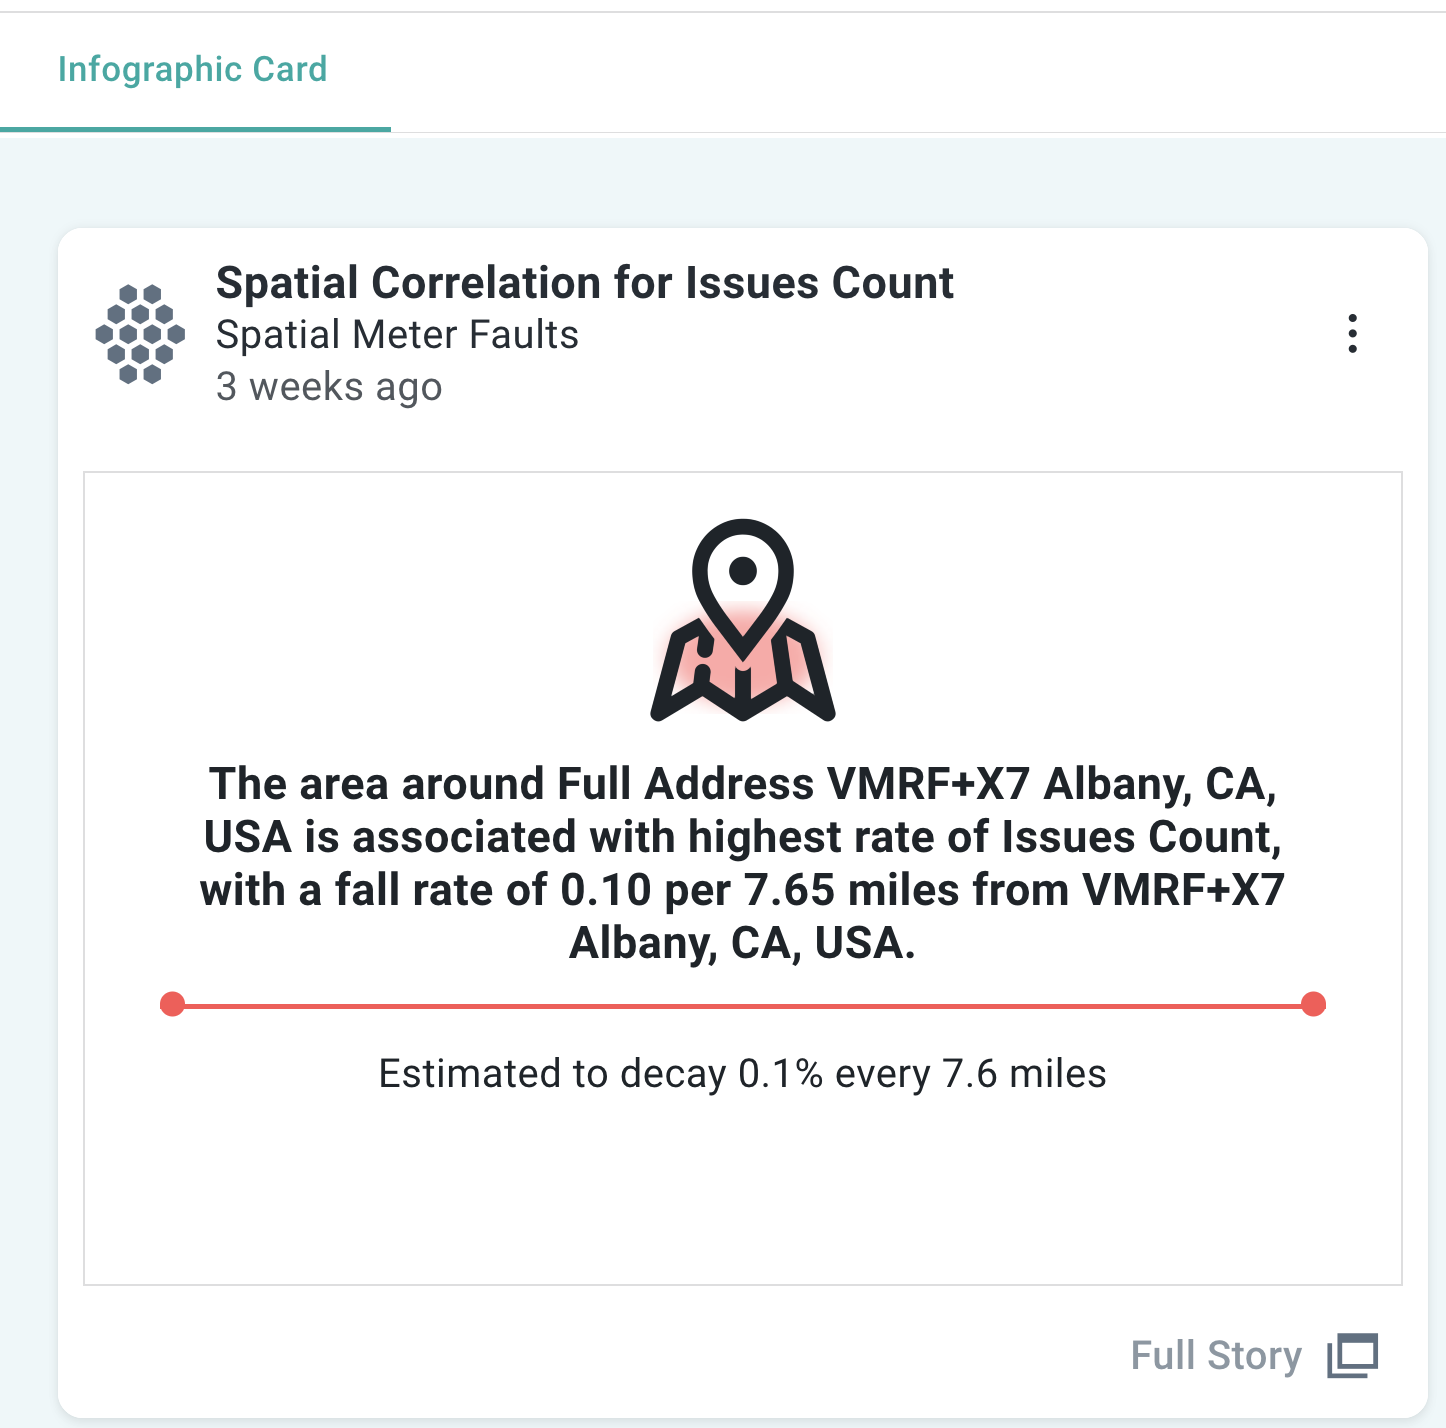
Infographics Insight
Full Story Insight