Quick Insights for Multi Time-Series Data
Intended audience: END-USERS DATA SCIENCE DEVELOPERS
AO Easy Answers: 4.3
Overview

Quick Insights can be generated at runtime by the user from Apps on the Easy Answers Results page, or from a scheduled task created by the Solution Developer using the Insight Composer in the AO Platform. This topic covers the Quick Insights relating to Multi Time-Series Data.
Multi Time-Series Quick Insights
Multivariate Trend Detection (Bayesian) - The Multivariate Trend Detection generates one Global Trend Line Insight for all series as well as one Individual Trend Line Insight and Trend Analysis for the Time Durations selected for each time series.
Multivariate Change Point Detection (Bayesian) - The Multivariate Change Point Detection generates one Individual Change Point Insight for the Time Durations selected for each time series.
Correlation - Time-Series - The Multivariate Global Insight generates a Correlation Heatmap Insight for all series.
Configuring Multi Time-Series Quick Insights
The Multi Time-Series Quick Insights have a number of Common Properties as well as a few additional unique properties per Quick Insight. When this Quick Insight is selected, the user can configure all the properties, or leave the default configuration as is and just decide on which individual Quick Insights should be added, eg. Outliers, Change Points, Trend Lines, and/or Correlation.
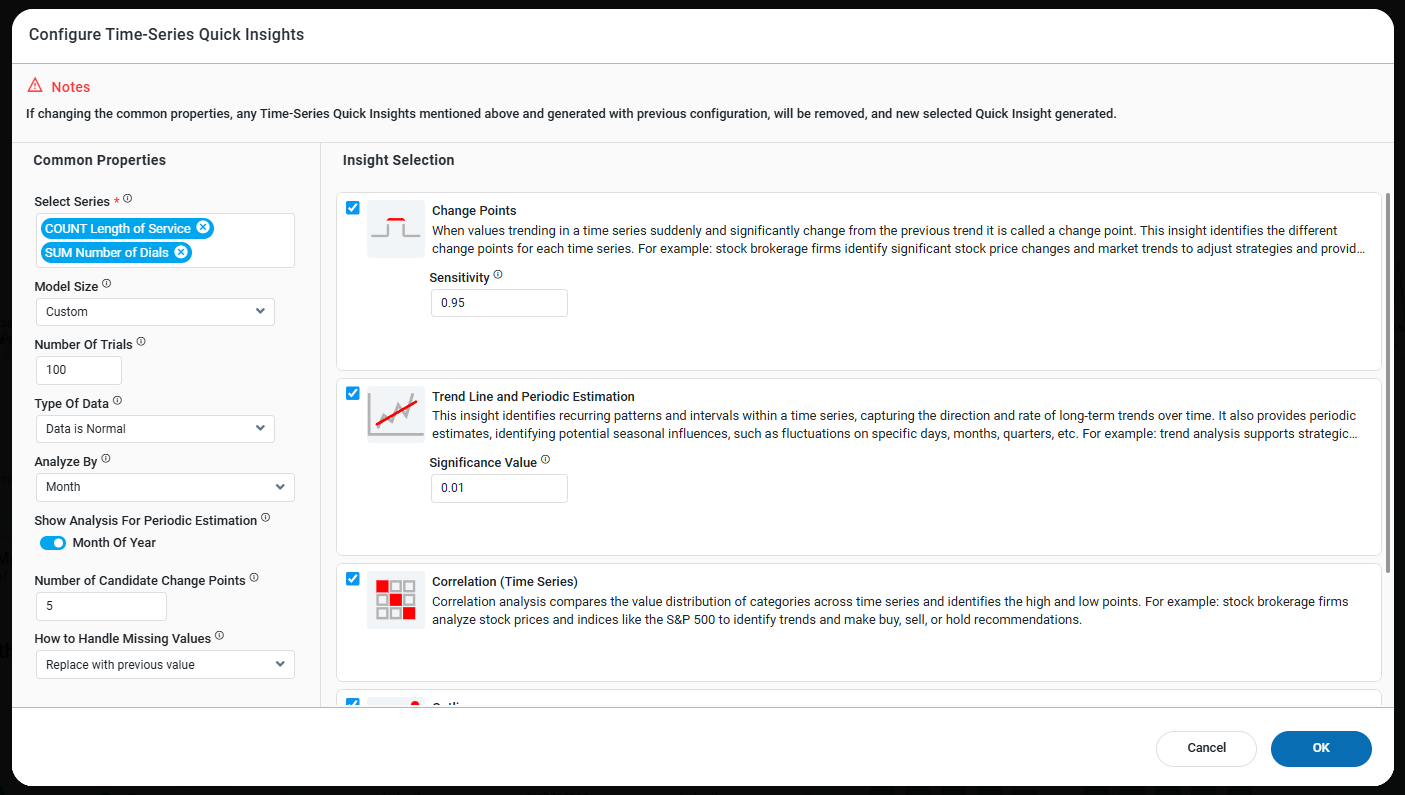
Common Properties
Label | UI | Default | Description |
|---|---|---|---|
Select Series | Tags field w/dropdown | Dropdown with multi-select - The user can select two or more field properties as input to the Quick Insight models. | |
Model Size | Dropdown | Default (2500) | Manage the model’s size. Larger models provide reliable interpretations at the cost of longer insight run times. Smaller models produce quicker results but lack the inclusiveness of larger counterparts.
|
Number of Trials | Number Field | 2500 | Enter a number for the number of Trial Samples. This field is only visible if the user has selected Custom in the Model Size field above. |
Type of Data | Dropdown | Data is Normal | Select the Type of Data from either of the following options:
|
Analyze By | Dropdown | Day | Time durations for which the data will be analyzed. Multi-select (tags) for one or more time duration values, including:
|
Show Analysis for Periodic Estimation | ON/OFF Toggles | One or more On/Off Toggles will show depending on the selection for Analyze By above. | |
Special Day Insight | ON/OFF Toggle | ON | Will generate additional insights relating specifically to configured Special Days for the Ontology. This toggle is only available if Day is selected for Analyze By above. |
Number of Candidate Change Points | Number field | 5 | Defines how many key trend shifts the system considers when analyzing business data.
|
How to Handle Missing Values | Dropdown | Replace with previous value | Select how the Insight model shall handle records with no values
|
Summary of Quick Insights
| Multi Time-Series | Correlation - Time-Series |
|---|---|---|
Number of Series | Should have at least 2 time series | Should have at least 2 series |
Type of Data | Continuous or Discrete Data | Continuous or Discrete Data |
Charts Examples | Time-Series Chart | Scatter Plot / Time-Series |
Examples | Time series of multiple stocks' data will give insights for trend, seasonality, outlier, and changepoint detection, global trend for all series, and correlation for each pair of series. | Time series of 2 stocks data will give insights into positive or negative correlation. |