Quick Insights for Single Time-Series Data
Intended audience: END-USERS DATA SCIENCE DEVELOPERS
AO Easy Answers: 4.3
Overview

Quick Insights can be generated at runtime by the user from Apps on the Easy Answers Results page or from a scheduled task created by the Solution Developer using the Insight Composer in the AO Platform. This topic covers the Quick Insights relating to Single Time-Series Data.
Single Time-Series Quick Insights (Bayesian)
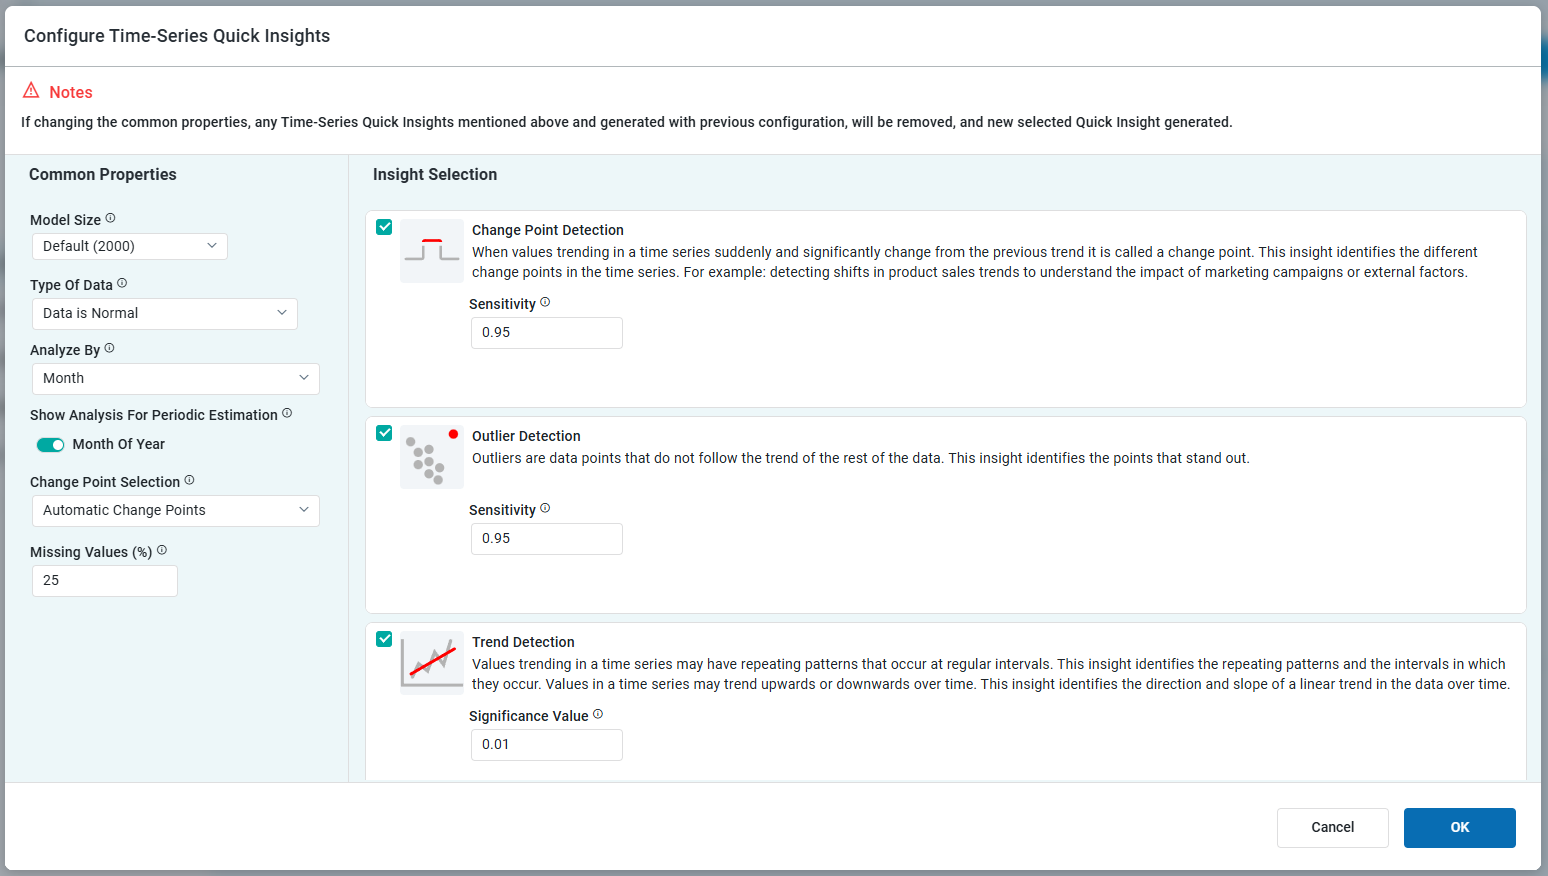
Outliers - Outliers are data points that do not follow the trend of the rest of the data. This insight identifies the points that stand out.
Change Points - When values in a time series suddenly and significantly change from the previous trend, it is called a change point. This insight identifies the different change points in the time series. Such abrupt changes may represent transitions that occur between states.
Trend Line - Values in a time series may trend upwards or downwards over time, or may have repeating patterns that occur at regular intervals. This insight identifies the direction and slope of a linear trend in the data over time.
Periodic Estimation - This insight is generated as part of the Trend Line Quick Insight. The output, however, is summarized for specific time durations, such as hours in a day, days in a week, months in a year, etc…
Forecast - Through time series analysis, the forecasting insight identifies the evolving future trend based on the past behavior of the time series data.
Configuring Single Time-Series Quick Insights
The Single Time-Series Quick Insights have a number of Common Properties as well as a few additional unique properties per Quick Insight. When this Quick Insight is selected, the user can configure all the properties, or leave the default configuration as is and just decide on which individual Quick Insights should be added, eg. Outliers, Change Points, Trend Line, and/or Forecast.
For the Single Time-Series Quick Insights using Exogenous Variables impacting Forecast, see Using Exogenous Variables.
Properties
Label | UI | Default | Description |
|---|---|---|---|
Model Size | Dropdown | Default (2000) | Manage the model’s size. Larger models provide reliable interpretations at the cost of longer insight run times. Smaller models produce quicker results but lack the inclusiveness of larger counterparts.
|
Number of Trials | Text Field | 2000 | Enter a number for the number of Trial Samples. This field is only visible if the user has selected Custom in the Model Size field above. |
Type of Data | Dropdown | Data is Normal | Select the Type of Data from either of the following options:
|
Analyze By | Dropdown | Month | Time durations for which the data will be analyzed. Multi-select (tags) for one or more time duration values, including:
|
Show Analysis for Periodic Estimation | On/Off Toggle(s) | One or more On/Off Toggles will show depending on the selection for Analyze By above. | |
Special Day Insight | On/Off Toggle | Off | Will generate additional insights relating specifically to configured Special Days for the Ontology. This toggle is only available if Day is selected for Analyze By above. |
Change Point Selection | Dropdown | Automatic Change Points | Select how Change Points will help the model adjust to significant shifts in business trends, including:
|
Number of Candidate Change Points | Number Field | Defines how many key trend shifts the system considers when analyzing business data. This field only shows when the Candidate Change Points value is selected in the Change Point Selection above.
| |
Select a Date(s)/Range | Date Field(s) | Defines specific Date(s)/Range for Change Points. This field only shows when the Custom Change Points value is selected in the Change Point Selection above. | |
Missing Values (%) | Text Field | 25 | Represents the percentage of missing data in the time series, helping assess data quality. It also defines the limit for how much missing data can be imported. A higher threshold allows the model to tolerate and fill in more missing values, which can impact forecast accuracy. |
Summary of Quick Insights
| Single Time-Series |
|---|---|
Number of Series | Should have 1 time series |
Type of Data | Continuous or Discrete data |
Charts Examples | Time-Series Chart |
Examples | Time series of a single stock's data will give insights into trend, seasonality, outlier, and changepoint detection. |