Intended audience: end-users data science developers
AO Easy Answers: 4.5
Overview
Quick Insights can be generated at runtime by the user from Apps on the Easy Answers Results page, or from a scheduled task created by the Solution Developer using the Insight Composer in the AO Platform. This topic covers the Quick Insights relating to Categorical Data.
What and Why?
Test for Rates
|
What? |
Why? |
|---|---|
|
|
Test for Means
|
What? |
Why? |
|---|---|
|
|
Test for Proportions
|
What? |
Why? |
|---|---|
|
|
Configuration Flow
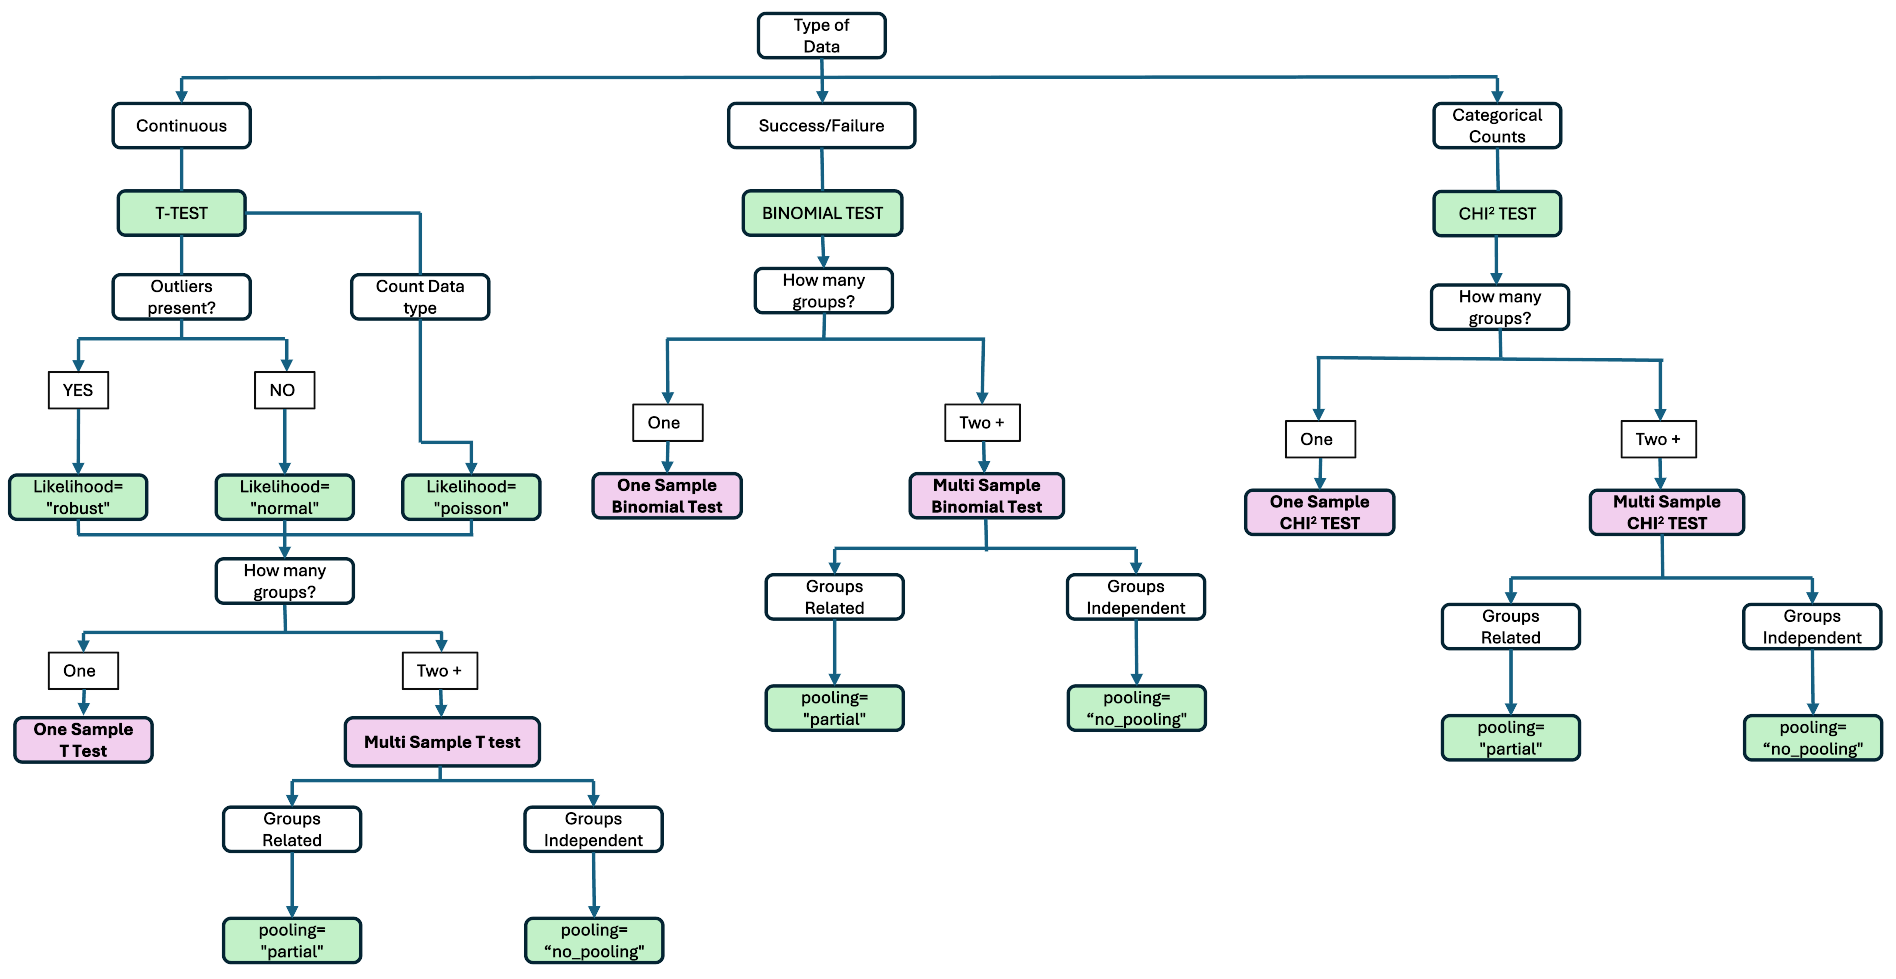
Statistical Tests
-
Test for Rates - Binomial Single Series Test -
Test for Rates - Binomial Test - 2 Series Group Comparison (Compare Group-1 with Sum of Group-1 and 2) -
Test for Rates - Binomial Test - 2 Series Group Comparison (Compare Group-1 with Group-2) -
Test for Means - One Sample T-Test -
Test for Means - Two Sample T-Test / AB Test -
Test for Means - Multi Sample T-Test -
Test for Means - Single Series T-Test (One Sample Data to 2 Groups) -
Test for Proportions - Chi-Squared Test
Contact App Orchid | Disclaimer