Intended audience: users
AO Easy Answers: 4.3
Overview
This type of Insight is generated by an AI system using a large language model (LLM) to compose an articulated response to the data presented in the Apps on the Easy Answers Results and Dashboards. Such a generated AI response is requested when the user clicks the lightbulb icon in any of the following locations:
-
on the Results page - this generates Data Summaries for all applicable Apps on the page.
-
on the Dashboards page - this generates Data Summaries for all applicable Apps on the page.
-
for individual Apps on the Results or Dashboards page (and on the Data Summary tab when in full-screen dialog) - only the selected App will have a Data Summary generated, if applicable.
-
in Insights Composer for Quick Insights - in the Preview dialog - this generates Data Summaries for one or more Quick Insights.
-
in Insights Composer for Quick Insights - in Preview of Runtime Profile - this generates Data Summaries for one or more Quick Insights.
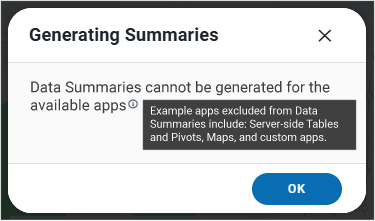
Some Apps do not support having Data Summaries generated, including Server-side Tables/Pivots/Calendar Apps, Map Apps, Cue Cards, and Custom Apps.
|
Results page |
Dashboards page |
Quick Insights |
|---|---|---|
|
|
|
Generating Data Summarizations
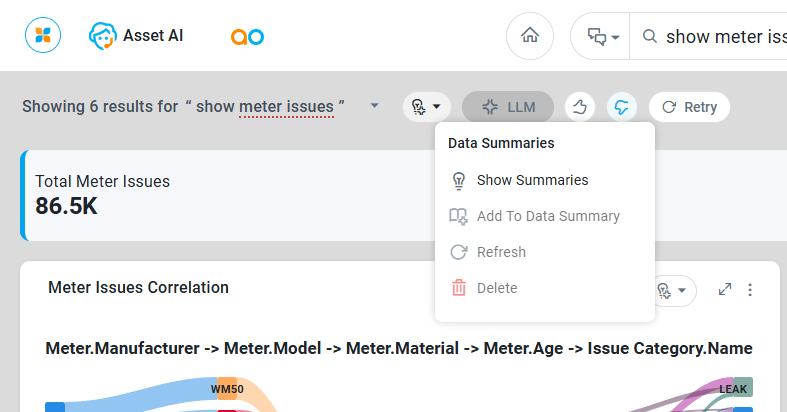
Clicking the lightbulb icon for Data Summaries starts the generation of the Data Summaries. While some Data Summarizations may take time to generate initially, the lightbulb icon turns green once the Insight is ready.
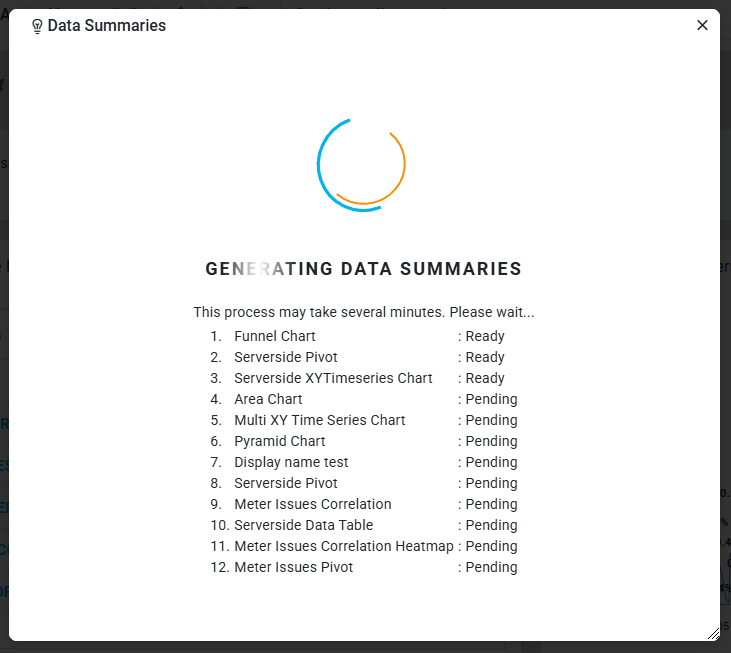
Once generated, the lightbulb icon shows a color to indicate the success or failure of the generation.
Lightbulb colors
-
Grey - Data Summaries have not yet been generated.
-
Green - Data Summaries have been generated successfully.
-
Orange - Data Summaries have been partially generated.
-
Red - Generation of Data Summaries has failed. The lightbulb icon will also show a “retry” decorator which allows the user to retry the request for the Data Summaries.
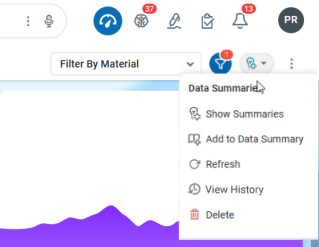
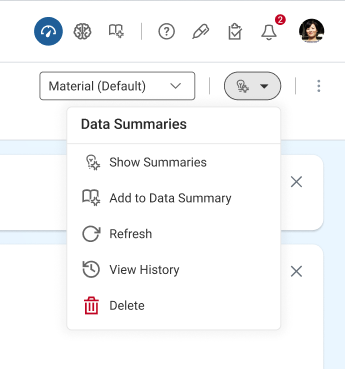
…and the following options are now available in the dropdown from the lightbulb icon:
|
Menu Options |
Results / Dashboard / Quick Insights Pages |
Individual Apps |
|---|---|---|
|
Show Summaries |
Opens a dialog showing Data Summaries for all applicable Apps. |
Opens the App in a full-screen dialog showing a tab with the App specific Data Summary. |
|
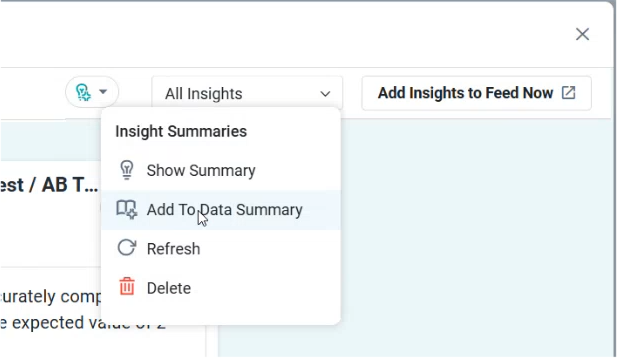
Add to Data Summary |
Opens a dialog - Add to Data Summary. |
N/A |
|
Refresh |
Refreshes Data Summaries for all applicable Apps. If an existing Data Summaries already exists, it’s refreshed, - otherwise new Data Summaries are generated. For a Dashboard, the unique combination of the Dashboard, Apps and Filters applied have to match to be refreshed. |
Refreshes the Data Summary for the selected App. If an existing Data Summary already exists, it’s overwritten, - otherwise a new Data Summary is generated. |
|
View History |
Show a History dialog for all previously generated Data Summaries. This is available on the Dashboards page only. See section below. |
N/A |
|
Delete |
Deletes the Data Summaries for all applicable Apps. |
Deletes the Data Summary for the selected App. |
Confirmation Dialogs
Some Data Summary tasks require additional user information or confirmation, including:
|
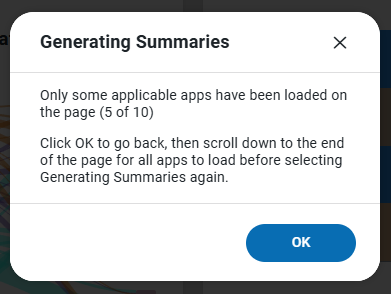
Only some applicable Apps have been loaded… |
Data Summaries cannot be generated for available Apps |
|
|---|---|---|
|
This happens if some Apps on the Results or Dashboards page have yet to be rendered/viewed by the user. |
None of the available Apps are applicable for Data Summary generation. |
|
|
|
|
|
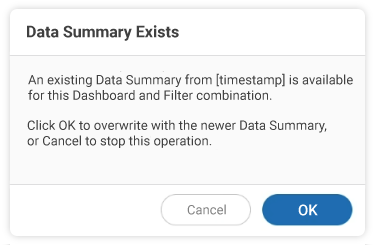
Data Summary for the Dashboard and Apps already exists |
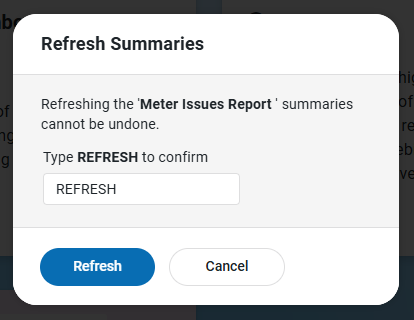
Refresh Data Summaries |
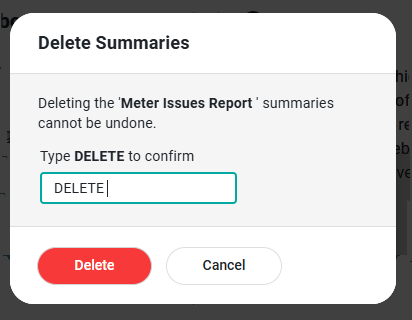
Delete Data Summaries |
|
If a Data Summary for the combination of Dashboard, Apps and Filters applied already exists during adding to the Data Summary page, the user will be requested to confirm the overwrite. |
If Data Summaries require a Refresh, the user will be requested to confirm as an existing Data Summary will be overwritten. |
If Data Summaries is being deleted, the user will be requested to confirm. |
|
|
|
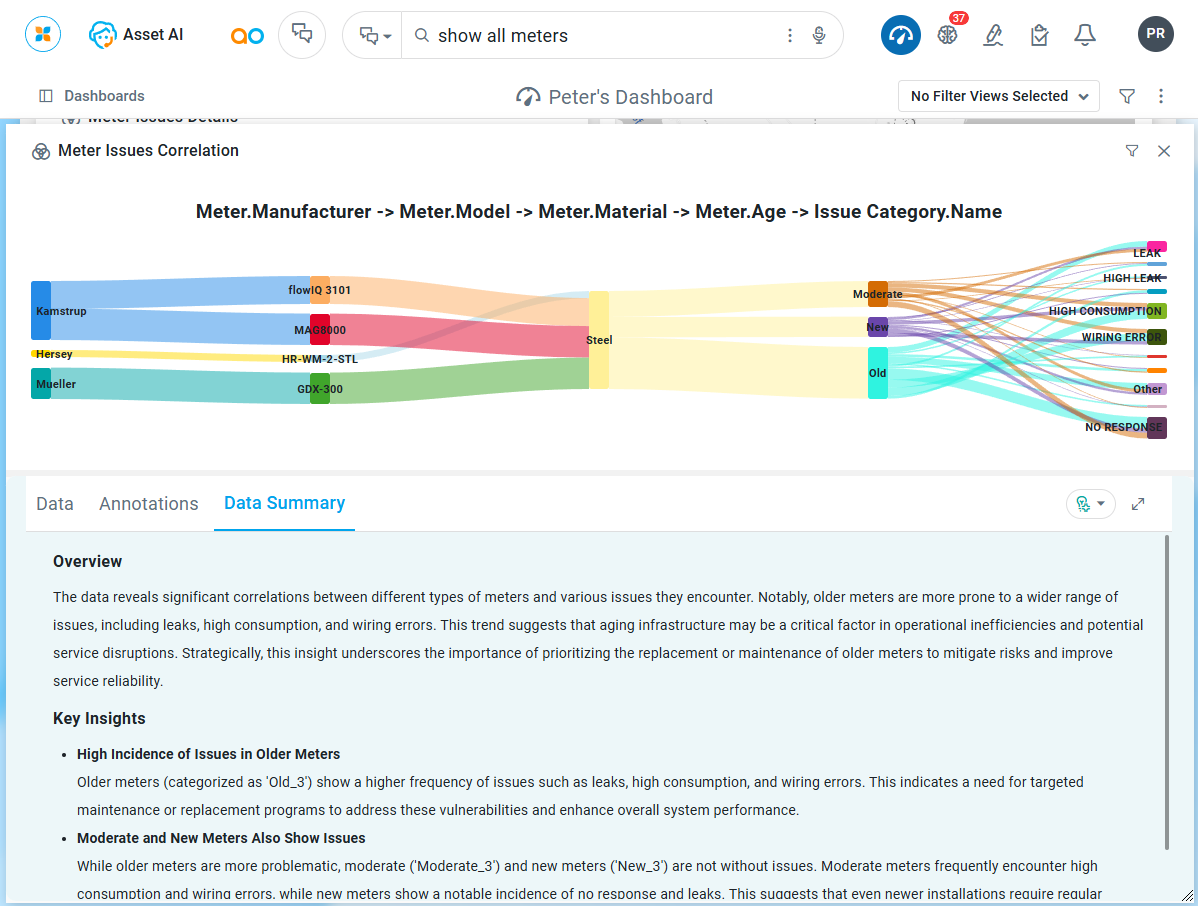
Showing Data Summaries
To view the Data Summaries option click the Show Summaries in the dropdown from lightbulb icons.
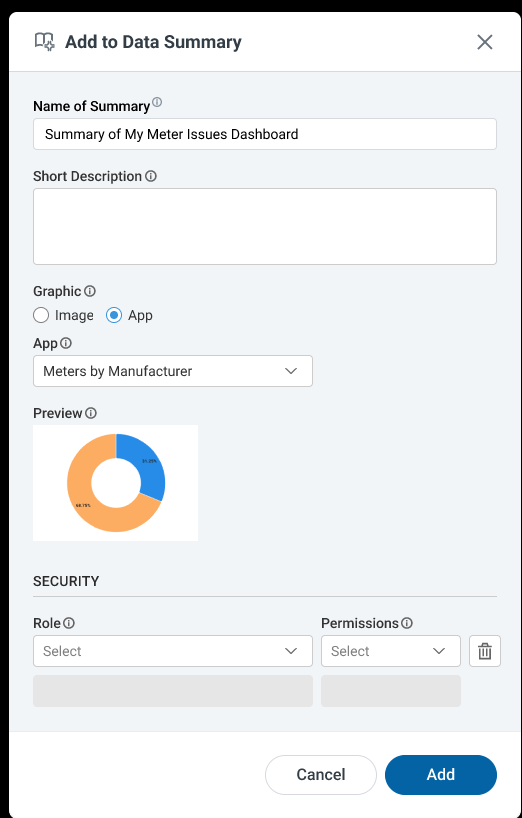
Add to Data Summary
To add a Data Summary to the Data Summaries page - generated for the full Results, Dashboards, or Quick Insights, the following dialog will show.
Properties
|
|
UI |
Default |
Description |
|---|---|---|---|
|
Name of Data Summary |
Text Field |
|
Enter a meaningful display name for the Data Summary being created. |
|
Short Description |
Multi-Line Text Field |
|
Enter a short description to make other users understand what the Data Summary is about. |
|
Graphic |
Radio-button options for Image or App |
|
Allows selection of cover images either from a predefined stock image library or existing visualizations from user applications. |
|
Image Selection |
|
Opens the File Manager dialog to allow selection of a predefined Image or uploading a new image. |
|
Dropdown w/Exiting Apps |
|
Select the visualization from one or more available app in the Results|Dashboard|Insight to represent the Data Summary. |
|
Color Picker |
|
Select a Background Color for the selected Graphic. |
|
|
|
Displays the selected Graphic on the selected Background Color. |
|
Security |
|
|
Section title for a repeater section |
|
Dropdown |
|
Select the Role of users to apply the Permission to. |
|
Dropdown |
|
Permissions must include “Edit” or “View” access to Data Summaries. See section below. |
Role-Based Permissions
Data Summaries are generated for Easy Answers Results, Dashboards, and Quick Insights; therefore, the Role-based Permissions related to Data Summaries have their foundation in the permissions granted to the respective sources.
In other words, Data Summaries generated for…
-
an Easy Answers Results page will use the assigned MSO Permissions (on MSO Composer > Security page)
-
a Public Dashboard will use the assigned Dashboard Permissions as the source.
-
a Quick Insight (Preview) will not have a source.
-
a Quick Insight (Preview for Runtime Profile) will use the Recipient Roles for Generated Insights added to Runtime Preview as the granted source.
Rules
|
Role-Based Source Permissions |
Additional Role-Based Permissions for Data Summaries |
Results |
|---|---|---|
|
None |
None |
|
|
Yes - View or Edit |
None |
|
|
Yes - View or Edit |
Yes - View or Edit |
|
|
None |
Yes - View or Edit |
|
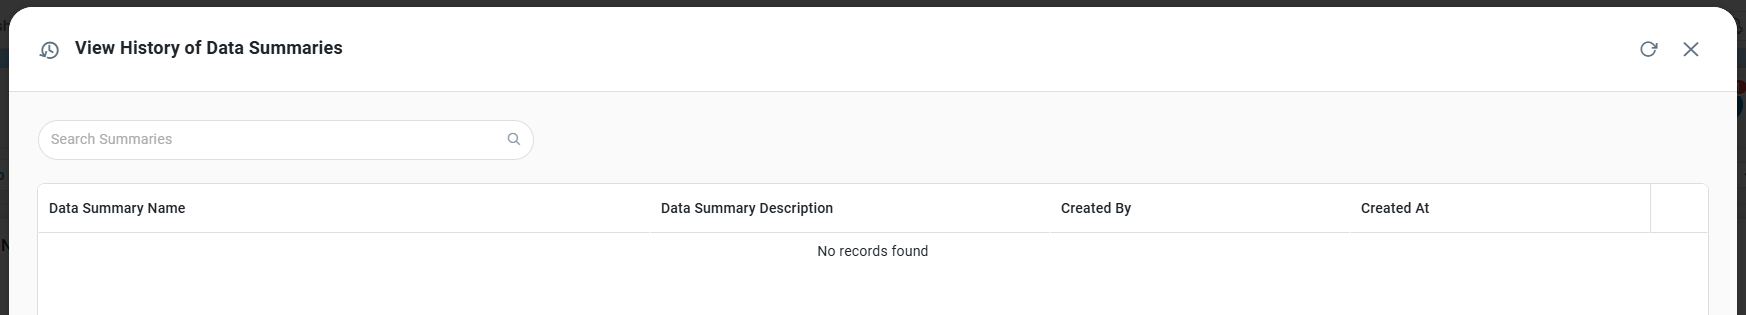
View History
This option in the Data Summaries dropdown is only available from the Dashboards page. It opens a dialog to view a History list of all the Data Summaries generated across all Dashboards. Additionally, for each entry in the list, the user can select to View History for only the selected Dashboard to see all the times a given Dashboard has had Data Summaries generated.
-
The dialog includes a table with the following columns:
-
Data Summary Name - shows the Data Summary Name with an external link icon - click the link to open the Data Summary on a new tab in the browser.
-
Data Summary Description - shows the Description for the Data Summary.
-
Created By - shows the username for the person who generated.
-
Created At - shows when the Data Summary was generated.
-
-
…and the following actions:
-
Search Summaries - enter a search term to find Data Summaries that match the search term.
-
Options menu for each item in the list:
-
View History - opens a dialog to show all History items for the selected Data Summary entry.
-
Delete - opens a Delete confirmation dialog.
-
-
Contact App Orchid | Disclaimer