Intended audience: end-users data science developers
AO Easy Answers: 4.3
Overview

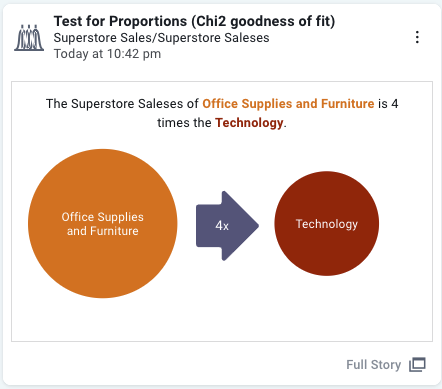
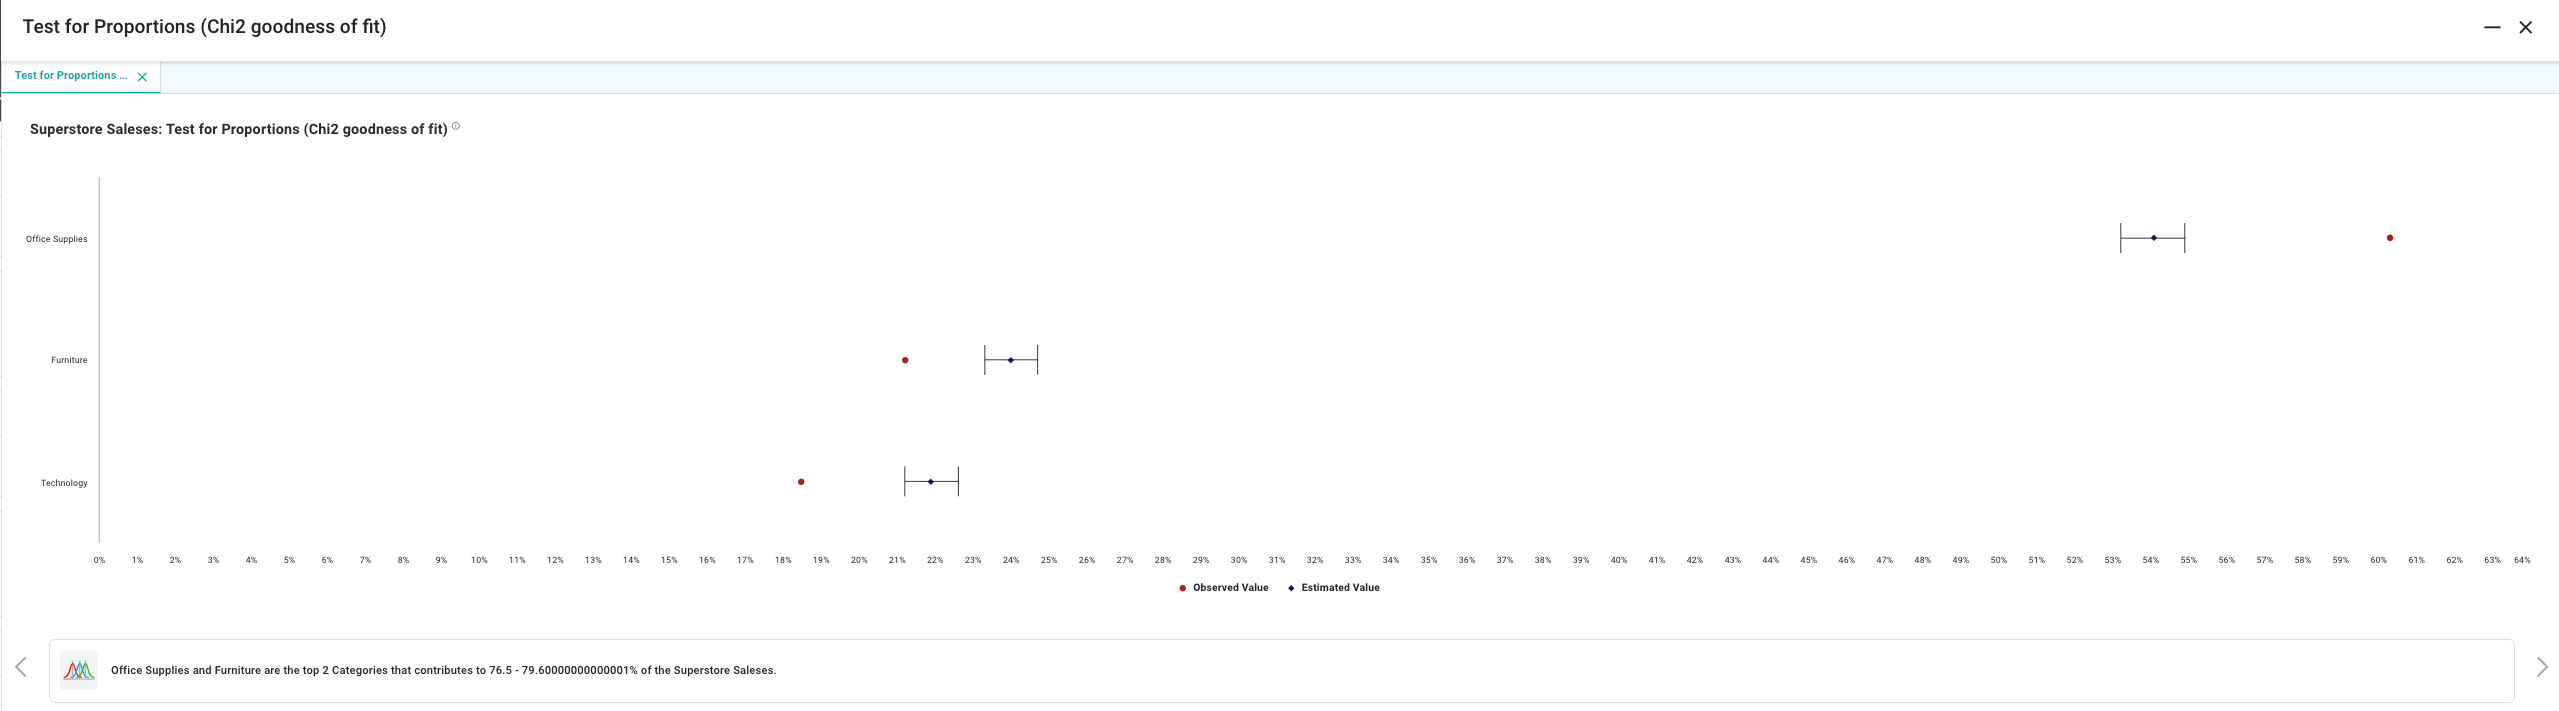
Chi-Squared analysis compares the value distribution of a category and identifies the high and low points.
Purpose
The Chi-Square Test or Test of Proportions is used to determine whether there is a significant difference between observed and expected frequencies in categorical data. It helps businesses assess whether customer preferences or behaviors across different categories are statistically different or if variations are simply due to chance.
Business Example
Consider a furniture and office supplies superstore that sells various categories of products, such as Chairs, Desks, and Storage Units. The company wants to know if the sales proportions of these product categories are consistent across three different regions or if sales trends differ significantly by location.
Scenario
The superstore collects sales data from three regions for three main product categories:
-
Region 1: 200 Chairs, 150 Desks, 250 Storage Units
-
Region 2: 180 Chairs, 220 Desks, 210 Storage Units
-
Region 3: 210 Chairs, 190 Desks, 230 Storage Units
The company applies the Chi-Square Test to determine if the sales proportions of these categories vary significantly between the regions or if the differences in sales are random and not region-specific.
Results
If the Chi-Square Test shows a significant difference, it indicates that sales proportions for Chairs, Desks, and Storage Units differ by region. The company could use this insight to tailor marketing efforts or adjust product availability based on regional sales trends. If the test shows no significant difference, it suggests that the sales proportions across regions are similar, and the observed differences are likely due to random variation.
Data Sample
|
Region |
Category |
Sales Qty |
|
|---|---|---|---|
|
Region 3 |
Chairs |
110 |
|
|
Region 1 |
Desks |
100 |
|
|
Region 3 |
Storage Units |
110 |
|
|
Region 1 |
Desks |
80 |
|
|
Region 3 |
Storage Units |
110 |
|
|
Region 2 |
Chairs |
70 |
|
|
Region 3 |
Desks |
60 |
|
|
Region 2 |
Desks |
70 |
|
|
Region 1 |
Storage Units |
100 |
|
Infographics Insight
Full Story Insight
End User Configuration - using Easy Answers solution
Contact App Orchid | Disclaimer