Intended audience: end-users data science developers
AO Easy Answers: 4.4
Overview
Quick Insights are Machine Learning Models used to generate deeper insights from the data retrieved in Easy Answers. Quick Insights can be generated in two different ways:
-
Interactively at Runtime - this is designed to be used by business users for ad-hoc use when generating answers from Easy Answers questions. The option is available from the App Options menu on the Easy Answers Results page. See Generating Quick Insights for Apps section below.
-
As a Scheduled Task - this option is designed for the Solution Developer using the Insights Composer in the AO Platform to build Quick Insights that execute on a schedule, adding deeper insights to the Easy Answers results. Such insights are added to the Insights Feed page in Easy Answers. See https://docs.apporchid.com/solution-development/?contextKey=insight-composer-page&version=latest.
For a high-level overview of the Quick Insights Models as well as how to use them, see the following topics:
For the details on each of the Quick Insight groups and their various output options, see the following topics:
Generating Quick Insights for Apps
-
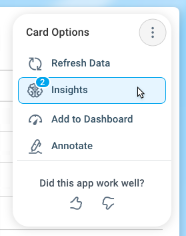
The Quick Insights creation is available from the Options menu for the generated Apps on the Easy Answers dashboard.
-
Insights - opens the Insights dialog.
-
-
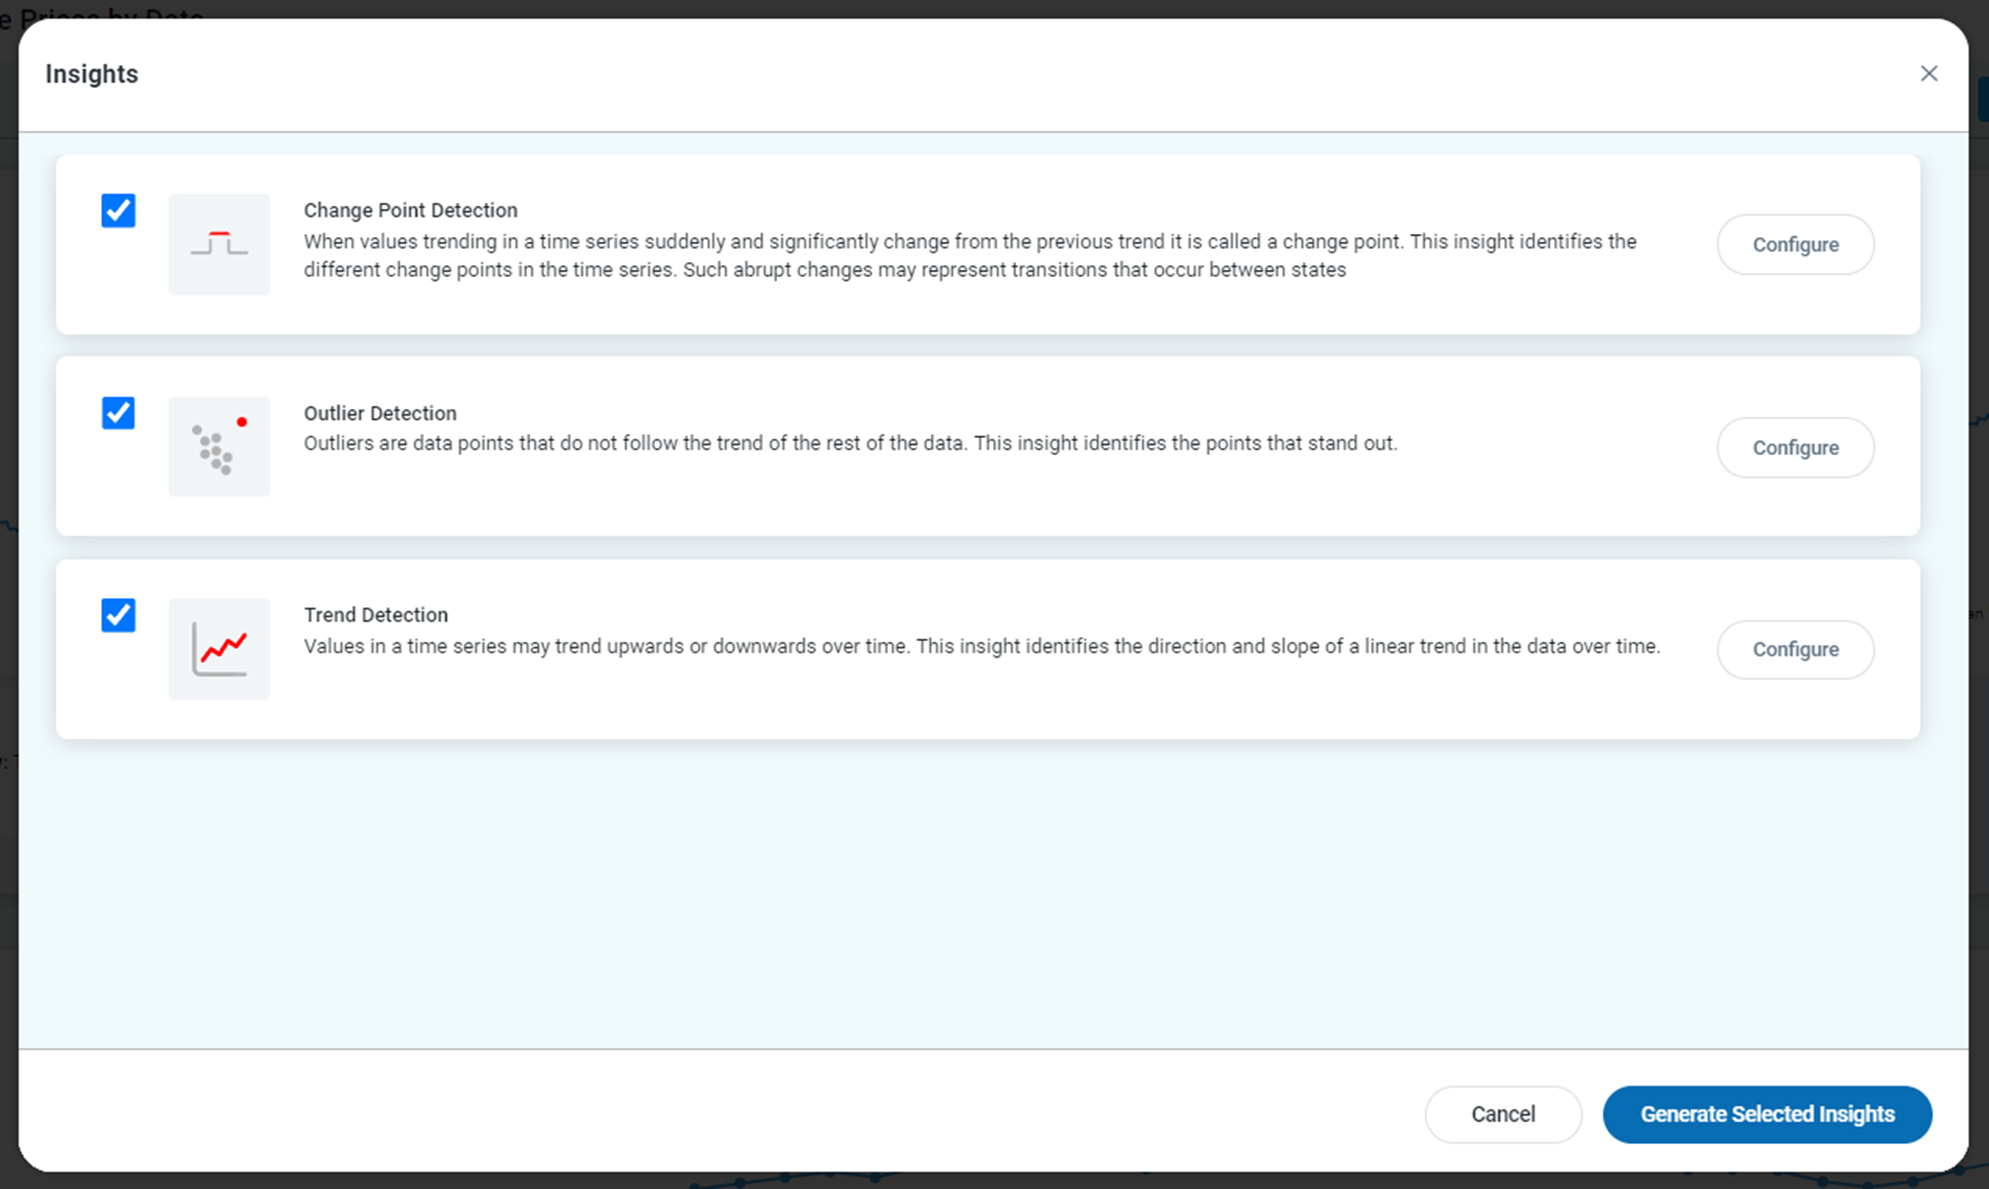
The Insights dialog shows the available Quick Insights appropriate to the App (and data) it was requested for, - allowing the user to select one or more Insights to be generated.
-
Click the Configure button to open a dialog with the available configuration properties per Insight.
-
Click the Generate Selected Insights button in the main dialog to generate the Insights.
Notifications and Insights Task Viewer
-
While the generation of Insights takes place, the user will receive Notifications, and the progress can also be monitored if opening the Insights Task Viewer from the User menu. See Notifications and Viewing Insight Tasks for details.
Viewing Quick Insights Results
-
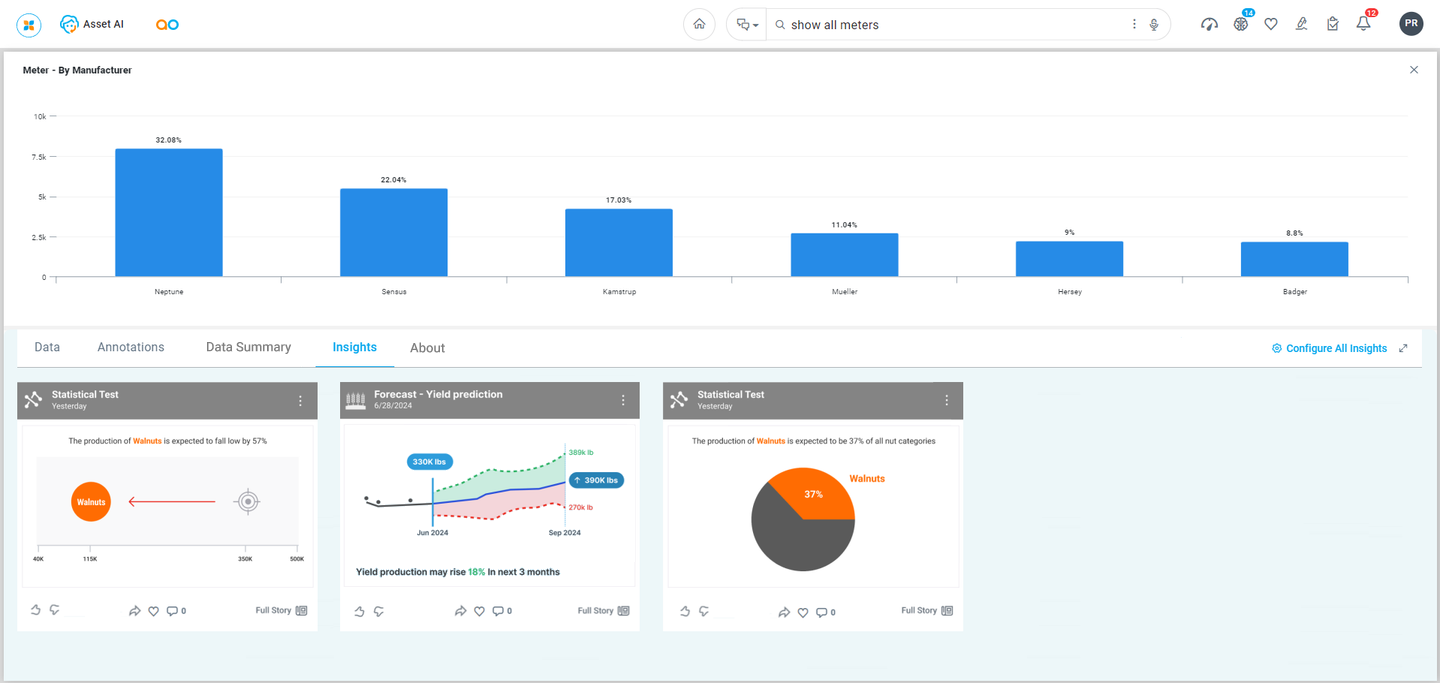
The Quick Insights will be shown on the Insights tab when generated by the user. Click the expand icon for the App, and the Insights tab can be found in the bottom half of the dialog.
-
Multiple charts can be generated for each Quick Insight based on the configuration of the Analyze By property. Each generated Quick Insight will be shown using the Infographic representation on the Insights page and corresponding Full Story details Chart/Textual Insight in a full-screen pop-up.
Options menu
-
Add to Dashboard - this option is only available from a specific card for Quick Insight and allows the user to add the card to a Named Dashboard.
-
Add to Insight Feed - this option will add the Quick Insight to the Insights page to share with other users.
Footer options
-
Thumbs Up/Down - click on either icon to provide your sentiment on the value of the shown Quick Insight Infographic card. If a Quick Insight Infographic card is added to the Insights Feed page, the user can Filter the cards based on Rating and that will take into considerations the recommendations based on clicking these icons.
-
Share - click to allow sharing a Quick Insight Infographic card with other users. This functionality is similar to sharing a Query. See Sharing a Query.
-
Add Favorite - click to add the Quick Insight Infographic card as a Favorite. If a Quick Insight Infographic card is added to the Insights Feed page, the user can filter the cards based on showing Favorite cards only. Look for the Favorite icon in the Header section of the Insights page.
-
Comment - click to add one or more Comments about the Quick Insight Infographic card. The Full Story dialog will open, and the cursor will go to the Comments tab, ready for Comments to be entered.
-
Full Story - click to open the Full Story dialog to view the details of the Quick Insight generated, including tabs for Data, Comments, etc…
Contact App Orchid | Disclaimer