Intended audience: end-users developers
AO Easy Answers: 4.3
Overview
The Easy Answers Question, when executed, will produce a Dashboard of one or more Apps that present the data requested. Some Apps may have additional functionality, including links, show details, drilldown options, or even a set of tools to select, measure, locate, etc…
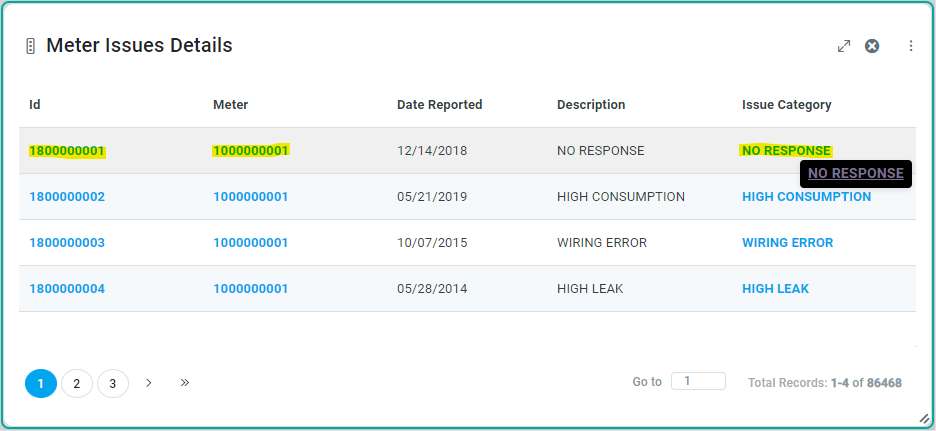
Tables with links
-
Links - some data elements in an App may show in a different color or with an underline link.
-
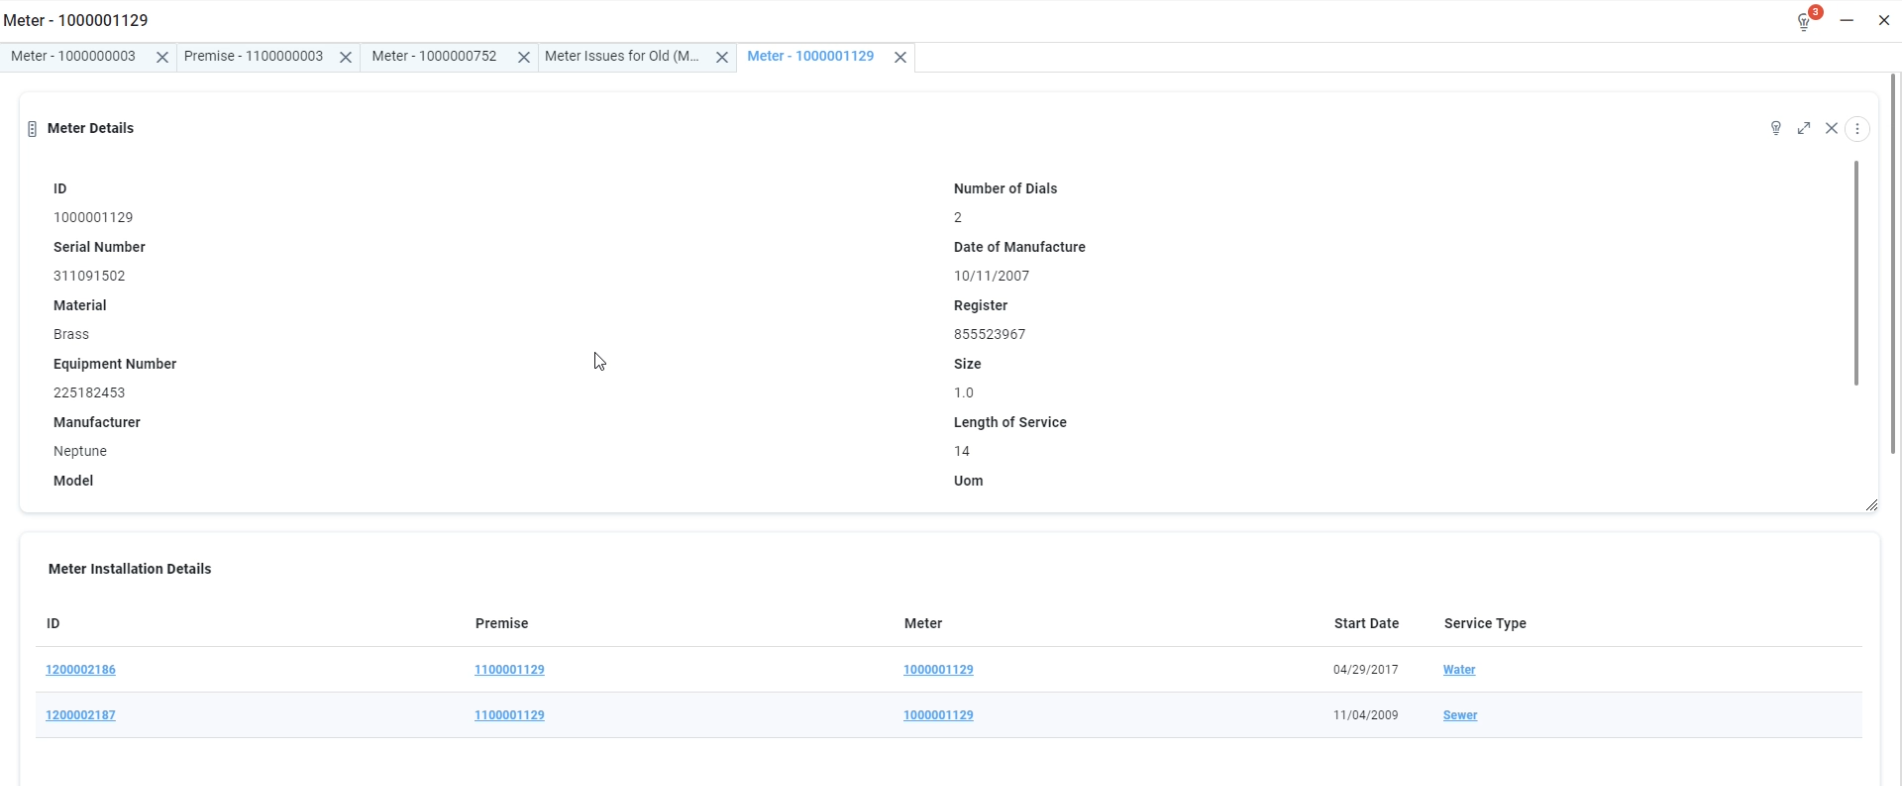
When clicked, a pop-up will appear showing additional Apps with details about the specific item clicked. Multiple links can be clicked which will open in Tabs within the pop-up.
-
If minimizing the pop-up dialog (instead of closing it), the main results page will show a button allowing the user to return to the existing pop-up dialog. A decorator number indicates how many tabs are available in the pop-up.

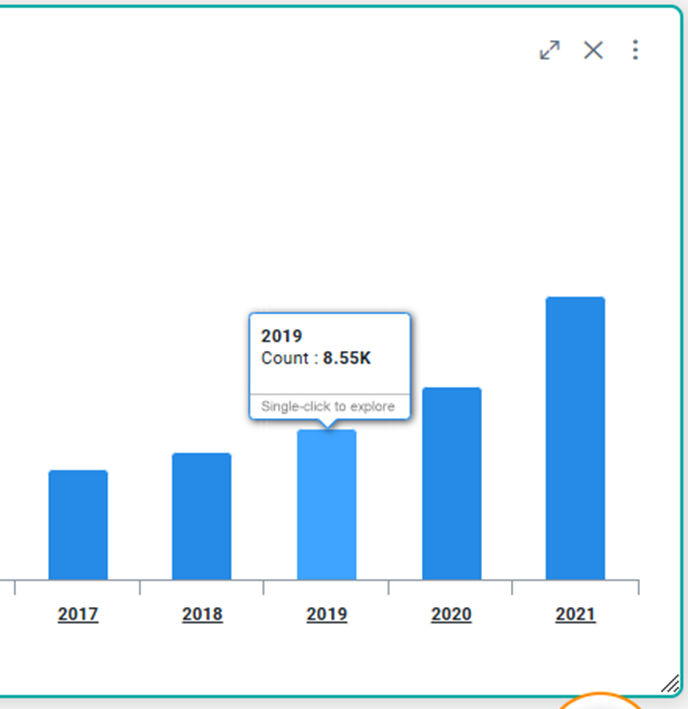
Charts
-
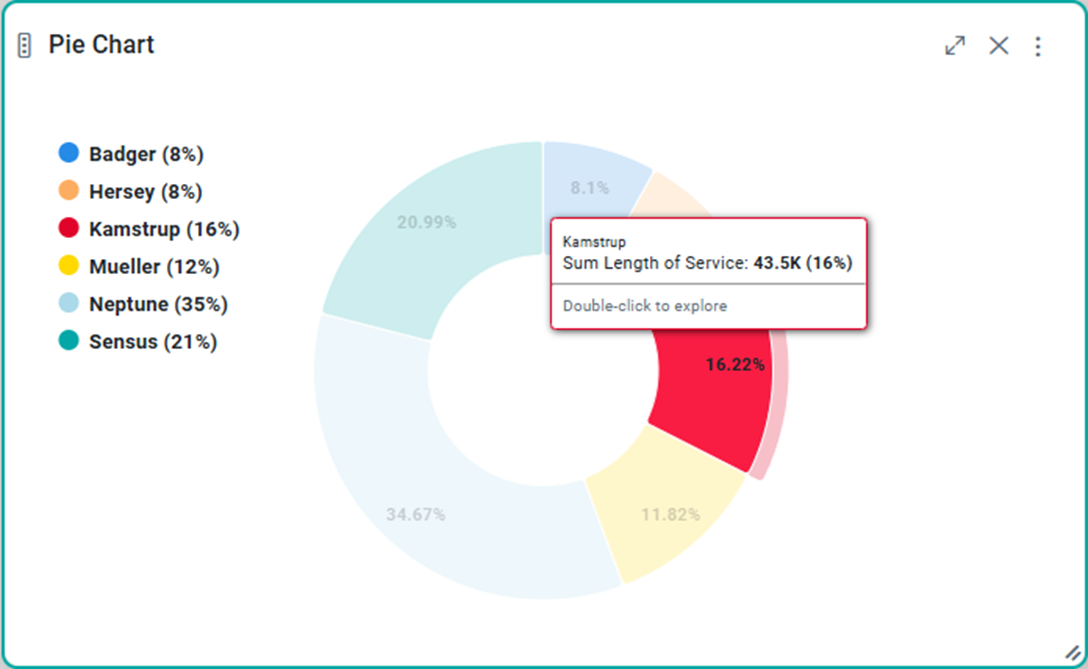
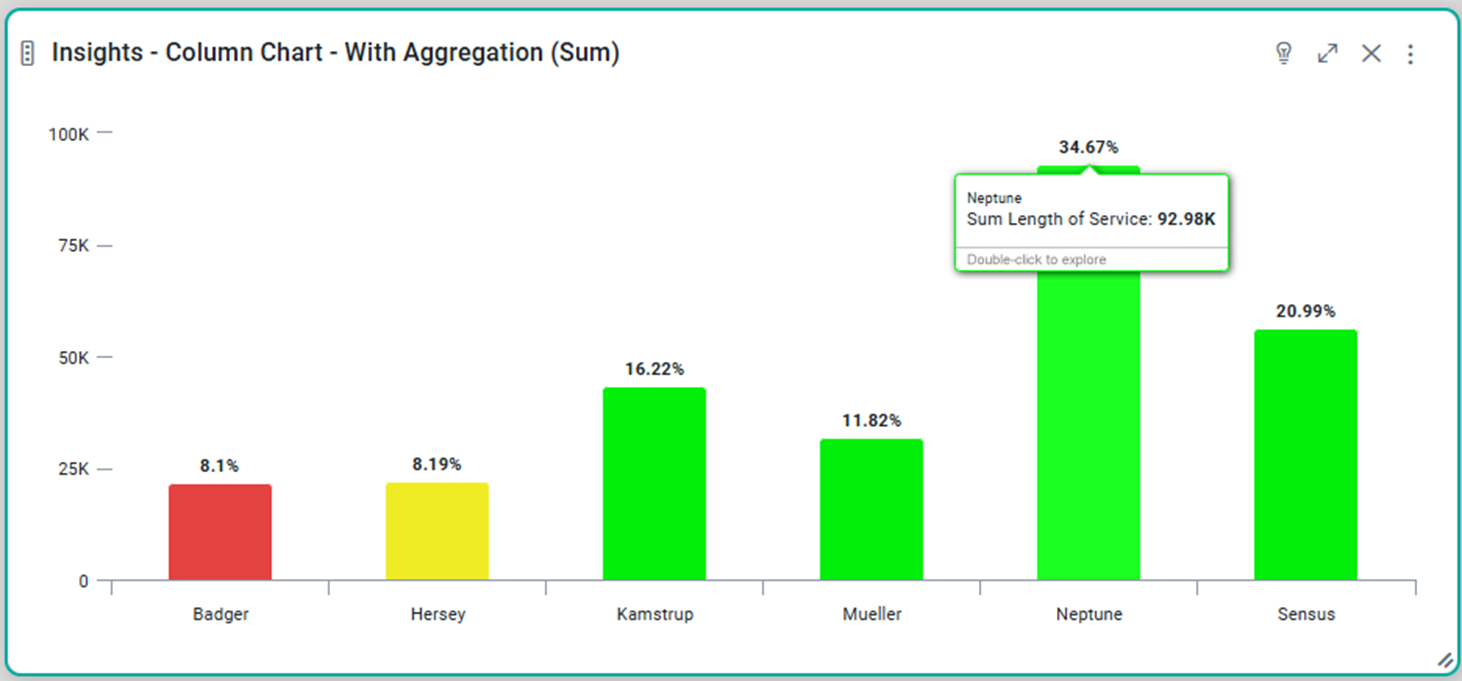
Popup with Additional Details - when double-clicking a Category in a Chart, such as a segment in a Pie/Doughnut Chart or a column/bar in a Column (or Bar) Chart, a popup opens showing one or more Apps with additional details relating to the selected item. When hovering a Chart element, the tooltip will indicate if there’s an action, such as “Double-click to explore”.
|
|
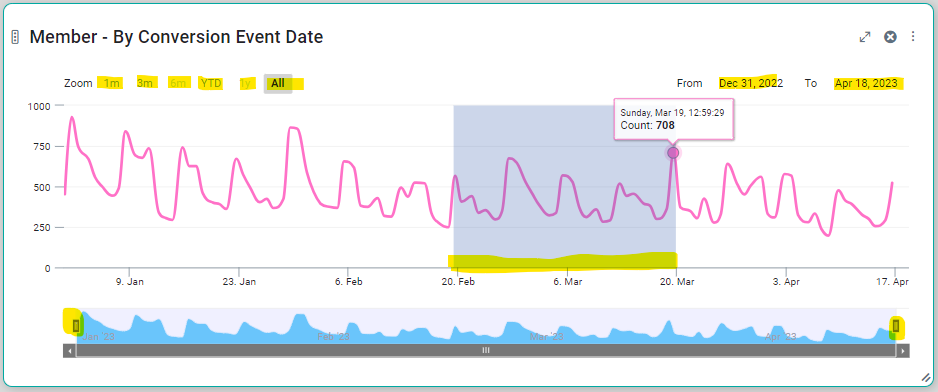
Charts representing a time-series
-
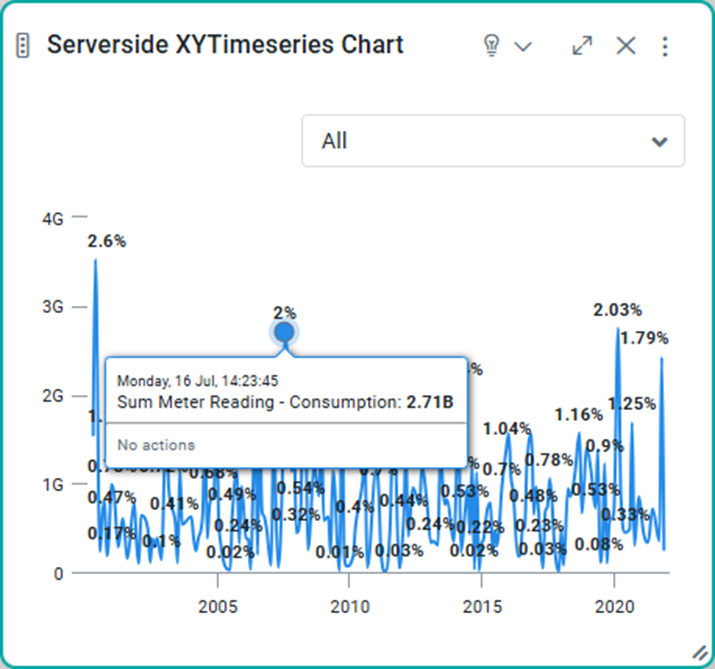
Selections/Filters - with some time-series Charts, it’s possible to select a subset of data using the mouse, click predefined buttons, or enter specific from/to dates to choose a time duration. If an App doesn’t have an action, such as single-/double-click, the tooltip will indicate: “No actions”.
|
|
-
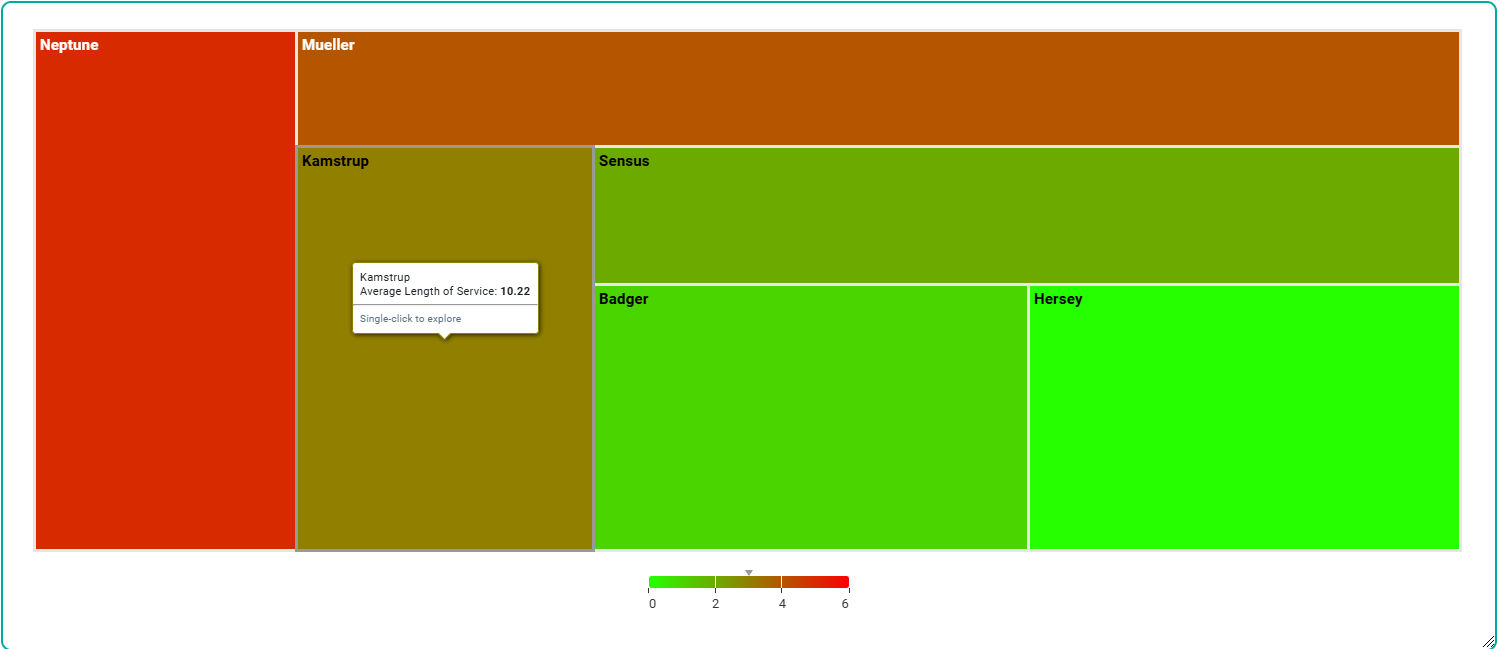
Drilldown - some charts may allow users to also single-click on a data element in a time-series Chart, and the current Chart with a timeline will be replaced by a new Chart showing a more detailed view of the timeline, eg. Year to Months, Months to Weeks, Weeks to Days, Days to Hours. When hovering Chart elements, the tooltip will indicate if there’s an action, such as “Double-click to explore”. Drilldown is also available in a Pivot Table and a Treemap as both can have a nested data structure, such as Country to Regions, Regions to States, States to Districts, Districts to Zipcodes.
|
|
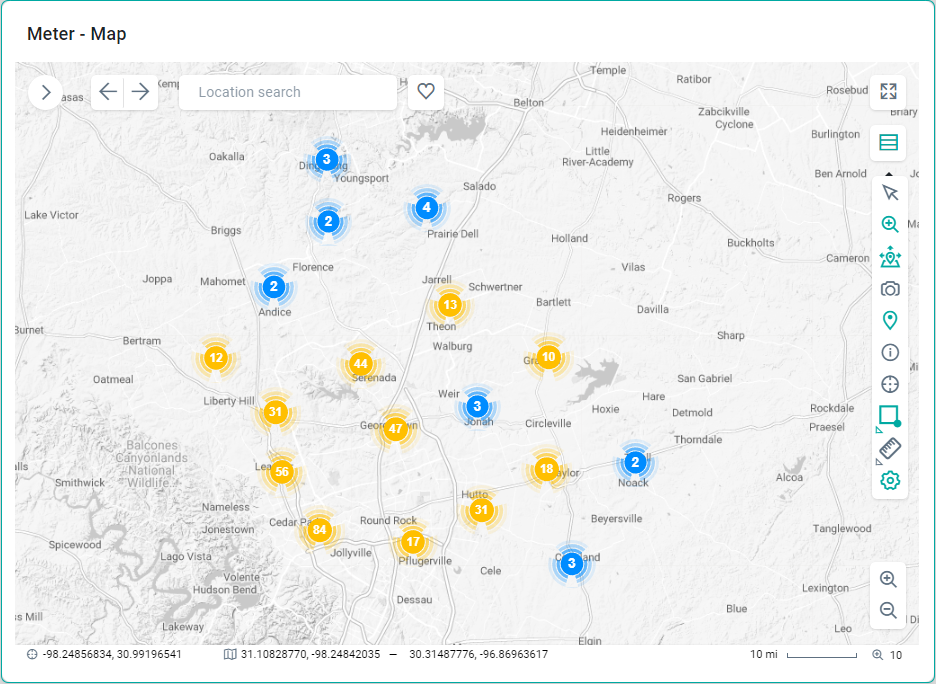
Map with Zoom and multiple Tool-based interactions
-
Map tools - map visualizations typically come with many different tools and interactive behaviors to allow users to pan and zoom in/out, perform selections, change background map, do location searches, etc… See Advanced Map.
Contact App Orchid | Disclaimer